


Sixth Grade - MATH
5: Math

Unit 1: Operations
Lesson 2
Multiplication Review
Students solve several problems that multiply a given rate by a quantity to find a total (e.g., Kayla earns $5.25 per hour and students compute earnings for 100 hours; Franco saves $1,700 per year and students compute savings for 23 years). Other real-world multiplication problems involve per-item rates (Jason: 175 pieces at 0.01 lb each) and costs (uniforms, plane tickets, magazine pages) that require multiplying a unit amount by a number of units.
Lesson 3
Division Review
Students compute unit-price and per-item rates in context (e.g., Kelli bought 12 bags for $77.40 and are asked to find $77.40 ÷ 12 = $6.45). Students solve rate-style division problems that give a total and a per-unit measure (e.g., Violet earned $82 for 8 hours to find pay per hour, Hendrick reads 35 pages/day to find days needed, and the watermelon problem divides total weight by weight per watermelon). Several decimal-division problems (e.g., 54 ÷ 4.5, 79.2 ÷ 2.2, and 42.8 ÷ 0.04) require students to produce quotients that function as unit measures or counts per unit.
Lesson 4
Exponents and Order of Operations
Students solve a real-world division problem in Activity 6 where they determine how much Dwayne earns per car by dividing $78 by 5; the answer key shows the unit rate $15.60. Students interpret a payment-for-service context (money per car) and perform the arithmetic to produce a per-item rate. Students practice division in applied word-problem format on the unit quiz, demonstrating the basic computation needed for unit-rate problems.
Lesson 6
Greatest Common Factor
Students practice dividing totals into equal groups using common factors and the GCF (e.g., Luisa splitting 24 gumballs and 36 lollipops into bags, Jacob making snack bags from 42, 36, and 54 items). Students set up and solve problems that find the greatest number of identical groups and compute how many items go in each group (e.g., Kendra's rows, Warner's tables, Cameron's fruit baskets). Students also rewrite totals as a common factor times a sum (e.g., 15 + 21 = 3(5 + 7)) to determine per-child or per-group amounts.
Lesson 8
Unit 1 Test
Students divide totals to find a value per unit in multiple problems (for example, Jorge earning $850 over four weeks: $850 ÷ 4 = $212.50 and Ashanti spending $650 over four weeks: $650 ÷ 4 = $162.50). Students solve division problems that require interpreting remainders and distributing quantities per unit (Benji's 172 crackers into bags of 12, Gloria's 42 scouts into cars carrying 5 each, and Ellie filling 135 ounces of ketchup into 2-ounce cups). Students perform standard-algorithm division with decimals on the Unit 1 test problems (e.g., 296.7 ÷ 4.3 = 69).
Final Project
Planning a Party
Students multiply the number of packages needed by the price per package to find total cost for an item (example: 3 × $4.80 = $14.40 for candy bars). Students complete a planning table that records total items needed, packages needed, and total cost for each item using given package prices. Students are asked to divide the grand total by 12 to calculate the cost per goody bag and to check that the total is under a $50 budget.
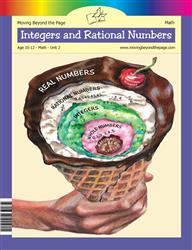
Unit 2: Integers and Rational Numbers
Lesson 1
Fraction Addition and Subtraction
Students perform a unit-price division problem in Basic Skills Review #3: Carrie bought 12 roller coaster tickets for $42; students compute the cost of one ticket ($3.50). The answer key shows the division $42 ÷ 12 = $3.50, which is an explicit real-world unit-price calculation.
Lesson 3
Fraction Division
Students solve many real-world division problems that divide a total amount by a unit-sized amount (for example: 3 ÷ 2/3 to find servings in a 3-cup container; 3/4 ÷ 3/8 to find sections of fishing line; Alana's laps and Simon's paint-per-frame problems). Students use visual models and the "Keep, Switch, Flip, Solve" algorithm to compute quotients of fractions and mixed numbers needed to answer those context problems. The activity set repeatedly has students find how many unit-sized pieces fit into a whole (number of sections, servings, laps, frames).
Lesson 8
Unit 2 Test
Students solve division problems that find how many unit-sized groups fit into a total, such as Zoe: 16 1/2 ÷ 1 1/2 = 11 servings and Mary Ellen: 14 2/3 ÷ 1 5/6 = 8 bags. Students complete modeled fraction-division problems (e.g., 6 ÷ 2/3 = 9 and 8 ÷ 4/5 = 10) and work with mixed-number division problems on the practice and test pages. The materials include tasks where students shade models and count groups of a given fractional size and perform algorithmic fraction-division (keep, switch, flip).
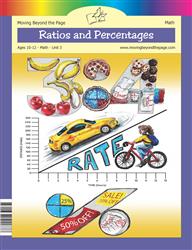
Unit 3: Ratios and Percentages
Lesson 1
Introduction to Ratios
Students practice scaling ratios and using proportional reasoning in multiple activities: they scale a bread recipe (Eduardo's 5 cups flour to 2 cups milk scaled from 3 loaves to 9 loaves), solve a mixing problem (50 ml cleaner to 5 L water scaled to 200 ml → 20 L), and solve a hours-proportion problem (Kendyll's piano to soccer hours scaled down). The Parent Plan explicitly lists understanding the concept of a unit rate a/b associated with a ratio a:b and using rate language as a skill to be learned. The lesson repeatedly has students form equivalent ratios by multiplying or dividing both quantities, which is the algebraic process underlying unit-rate work.
Lesson 2
Describing Ratios in Words and Pictures
Students write ratios in three forms (e.g., 1 to 2, 1:2, 1/2) and interpret phrasing like "one slice of toast and two eggs for each camper," which frames a "per 1" relationship. Students scale ratios to find equivalent ratios (e.g., 2:5 scaled to 6:15 in the boys-to-girls problem and the chef scaling 10 heads of lettuce to 30 heads and corresponding tomatoes). Students reduce ratios to smaller equivalent ratios (e.g., 12 red pens to 21 blue pens reduced to 4:7), showing practice with proportional reasoning.
Lesson 3
Equivalent Ratios
Students solve unit-price problems such as "Determine the cost of 6 sodas given that 2 sodas cost $5" and "how much for 2 basil plants if 8 cost $24" using double number lines. They solve constant-speed problems like "Janelle runs 100 meters in 20 seconds; how long to run 20 meters?" and "Carlo makes 2 sandwiches every 3 minutes; how long to make 12 and 40 sandwiches?" Tables and graphs tasks (e.g., Misha typing 12 sentences in 2 minutes and 24 in 4 minutes to find time for 18 sentences) require students to compute rates and scale to different amounts.
Lesson 4
Unit Rates
Students are shown and solve explicit constant-speed unit rate problems such as Elena driving 216 miles in 4 hours (216 ÷ 4 = 54 miles per hour) and Odette reading 240 pages in 3 hours (240 ÷ 3 = 80 pages per hour). Students compute unit prices in multiple contexts (strawberries 3 quarts for $5.25 → $1.75/quart; jellybeans $6.27 for 3 pounds → $2.09/pound; comparing 16‑oz vs 40‑oz bags) and then use the unit rate to find totals. Students are taught and practice both methods (forming equivalent ratios/diagrams and dividing the numerator by the denominator) and complete practice problems and a quiz that require tape diagrams, double number lines, and division to solve unit rate and unit price problems.
Lesson 5
Percentages
The Basic Skills Review includes a unit-price problem: "A 14-ounce box of cereal costs $3.92. What is the unit price per ounce of cereal?" and the answer key shows the procedure: divide the ratio 14:3.92 to get 1:0.28 ($0.28/ounce). The review also has a ratio-scaling item (Jamie's team won 5 games for every 1 lost; if lost 3 games how many won?) that has students form and use equivalent ratios.
Lesson 7
Unit Conversions
Students make an Interactive Notebook page of unit conversion ratios and categorize conversions by system and quantity (length, mass, capacity). Students use double number line diagrams and equivalent-ratio setups to scale known conversion ratios (e.g., 1 quart = 2 pints to find 3 quarts = 6 pints; 1 in = 2.54 cm to find 10 in = 25.4 cm; 1 oz ≈ 28.35 g to find 5 oz ≈ 141.75 g). Students complete practice problems that require multiplying or dividing by conversion factors (e.g., cups to fluid ounces, kg to g, feet to inches) and check answers with an answer key showing the equivalent-ratio calculations.
Lesson 8
Unit 3 Test
Students are asked to "calculate a unit rate and a unit price" in the unit goals, and multiple tasks require finding unit rates: Braden riding 19 miles in 2 hours (miles per hour), peaches at $5.16 for 4 lb (unit price per pound), a dozen roses for $32.40 (unit price per rose), a machine making 1,200 pieces in 40 minutes (pieces per minute), and a printer printing pages per minute. The activities require students to compute these rates using division and to represent problems with double number line diagrams, tables, tape diagrams, and graphs.
Final Project
What's the Best Buy?
Students collect prices, package sizes, and record ratios on data tables and then calculate unit prices by dividing total cost by number of units (Activity 3 shows $3.38 ÷ 13 oz = $0.26/oz). The parent plan and skills list explicitly include "Solve unit rate problems including those involving unit pricing and constant speed," and the extension activity "Ratios All Around" asks students to use a speed of 1 mile per 6 minutes to determine travel time for a given distance. Students also convert between units (gallons to fluid ounces) using a series of equivalent ratios so unit prices are comparable across different measures.
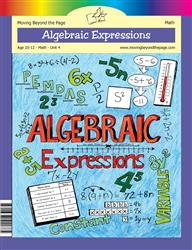
Unit 4: Algebraic Expressions
Lesson 1
Introduction to Algebra
Students are asked to write expressions that model ‘per' situations (for example, "if you get paid $5 for every car you wash… the expression for your pay is 5n" and problems like "There are 36 cookies in a box. How many cookies are in n boxes?"). Several activities require students to write and evaluate expressions of the form constant × variable (e.g., 5n, 20n, 36n) and to interpret variables that represent changing quantities. The activities also ask students to translate word phrases into algebraic expressions that express repeated or per-unit relationships.
Lesson 3
Working With Expressions
The Basic Skills Review asks: "Max runs 4 miles for every 3 miles that Gina runs. If Max runs 24 miles this week, how many miles will Gina run?" which requires students to use ratio reasoning and scale equivalent ratios. Several real-world contexts present rates as algebraic expressions (Josie earns $3 for each dog she walks → 3n; Janie earns $10 for every hour babysitting → 10n; Matt earns $4 per yard chore plus a $5 allowance → 5 + 4y), and students evaluate those expressions for given quantities. A unit-conversion item (Kendrick: gallons to quarts) requires students to apply a per-unit factor (4 quarts per gallon) to scale quantities.
Lesson 5
Equivalent Expressions
The Basic Skills Review #8 (Problem 4) asks students to find Elias's push-ups per minute and to find how many push-ups he could do in a given number of minutes, and the answer key shows computing the unit rate (42 ÷ 3 = 14 push-ups per minute) and using it to find a total for additional minutes (14 × 5 = 70). The review problem explicitly asks for a per-minute rate and an extrapolation to a longer time, demonstrating work with a constant rate.
Lesson 7
Unit 4 Test
Students write and choose expressions that model per-unit situations, for example selecting 12n + 5 to represent Zane earning $12 per hour plus $5 per paycheck and selecting 5x + 3 for Jeremiah earning $5 per dog plus a $3 tip. Students use multiplicative scaling in context, for example writing 12(x + 6) and using the distributive property to produce 12x + 72 for the beads problem, and they evaluate these expressions for particular values of the variable to find total amounts. Several word problems present rate-like language (dollars per hour, dollars per dog) that students translate into algebraic expressions.
Unit 5: Algebraic Equations
Lesson 3
Solving One-Step Equations, Part 2
Students set up and solve one-step equations from word problems that involve rates or per-item relationships (for example, 12y = 96 for Alex earning $12 per car and x/6 = 3 or x/3 = 6 for the bird seed/feeder problems). Students write equations for real-world situations (e.g., 5n = 40 for the plant-growth problem, 2n = 12 for the canoe-distance problem) and use inverse operations (division or multiplication) to find the unknown. Activity pages require students to check solutions by substituting values back into the original equations.
Lesson 4
Solving Two-Step Equations
The lesson includes a section on independent and dependent variables that asks students to list and graph ordered pairs of distances and times and to write equations such as d = 65t to represent motion at constant speed. Activity prompts (Activity 4) ask students to identify dependent and independent variables and to use examples related to motion and speed, money and work, and to create tables based on equations. Students are instructed to analyze relationships between the dependent and independent variables using graphs and tables.
Lesson 6
Solving Inequalities
Students write and solve inequalities that represent a quantity per unit, for example setting up 5n ≤ 75 for Gabriel's weekly earnings and solving n ≤ 15 to find money per week. Students also set up n/3 ≥ 25 for Mayor Johnson's jelly beans and solve n ≥ 75 to find the total given a per-jar minimum, which involves reasoning about quantities per group. Several word problems require dividing a total by a number of units and interpreting the resulting inequality solution.
Lesson 7
Independent and Dependent Variables
Students are introduced to unit rates with the Tonya example (45 miles in 1 hour) and the equation d = 45t that links constant speed to a two-variable equation. Students write and use unit-rate equations in real contexts such as Kevin's pay (10x = y) and Ron's biking (5x = y). Activities require students to compute outputs and inputs (e.g., how many miles in 6 hours, how many hours to earn $140) using tables, graphs, and substitution/inverse operations.
Final Project
All About Me
Students are required to create at least one two-variable equation and accompanying table and to describe the relationship (e.g., the example 2x = y showing piano practice is twice soccer practice and asking "How long is soccer practice if piano practice is 4 hours?"). The project requires using multiplication and division among the problems and asks for tape/hanger diagrams and a table to represent relationships between quantities. Students must solve equations and check answers by plugging solutions back into the original equations or inequalities.
Unit 6: 2D Geometry
Lesson 2
Working With Angles
The Basic Skills Review includes problem 5: students are given that a machine produces 208 gumdrops in 4 minutes and are asked to use equivalent ratios to determine how many gumdrops the machine can make in 1 minute. The answer key shows the unit-rate solution (208 ÷ 4 = 52 gumdrops per minute), indicating students compute a unit rate by dividing total output by time. The review frames this as an equivalent-ratio/unit-rate exercise within the mixed-skill practice.
Lesson 4
Area
Students compute how many pavers are needed by converting the walkway from feet to inches, finding the area of one paver (6 × 4 = 24 in²), finding the area of the walkway (120 × 36 = 4,320 in²), and dividing to get n = 180. Students solve a similar division problem for Thuy's garden: they convert yards to feet, compute the garden area (9 × 6 = 54 ft²), and divide by coverage per package (3 ft²) to get 18 packages. Additional word problems (Brandi's tiles, tray tiling) ask students to find how many tiles are needed by computing areas and dividing total area by tile area.
Lesson 6
Scale Drawings
Students set up and use unit-rate ratios between drawing units and real-life units (for example, 1 cm/4 ft and 1 in/5 ft) to compute actual or drawing measurements (e.g., 120 ft -> 30 cm; 6 in -> 30 ft; 4 in -> 20 ft). Students write and solve proportions, use double number lines, and simplify ratios to find scale factors and convert those ratios to percentages. Students apply those unit rates to compute lengths, perimeters, and areas of scale drawings.
Unit 7: 3D Geometry
Lesson 2
Surface Area
Students compute unit prices in the Basic Skills Review: Problem 7 asks students to find the unit price per ounce for a 24-ounce bottle costing $3.12, and the answer key shows dividing 3.12 by 24 to get $0.13 per ounce. Students also work with unit-priced items elsewhere (Michael buys 2.5 lb of grapes at $1.58 per pound) where they use the given price-per-pound to find total cost. The answer keys explicitly demonstrate the arithmetic steps for finding and using unit rates in these cost contexts.
Lesson 5
Problem Solving With Solids
Students divide a total amount by a per-unit amount to find how many units are needed (Archie divides 528 in.^2 by 275 in.^2 per package to get 1.92 and rounds to 2 packages). Students divide total volume by single-item volume to find counts (the salt-factory example: 45,000 cm^3 ÷ 600 cm^3 = 75 boxes; puzzles-in-bin and boxed-puzzle problems use similar divisions). Students set up and solve an equation to find a per-item fee (Basic Skills Review: 5n + 10 = 130 leads to n = $24 per lawn).
Lesson 6
Unit 7 Test
Students solve several real-world division problems that use a per-unit measure: in Kareem's paint problem students compute the surface area of a rectangular prism and divide by the coverage of one can (10 ft2) to find how many cans are needed. In the decorative-paper problem students compute the surface area of a cube (150 in2) and divide 3,000 in2 by that unit amount to find how many boxes can be covered. Other items (Bella's flute case and the soap prism) require dividing volume by base area or total volume by unit measure to find a height or length, which practices per-unit computations.

Unit 8: Statistics
Lesson 2
Populations and Samples
Students encounter a rate problem in the Basic Skills Review: a candy factory produces 85 pieces of bubble gum each minute and students calculate how many pieces are produced in 12 minutes. The answer key explicitly frames the rate as 85:1 and directs students to multiply both parts of the ratio by 12 to get 1,020:12, so students practice scaling a given rate to a different time period.
Lesson 8
Making Inferences
The Basic Skills Review includes Problem 1 asking students to find miles per hour for a train that goes 600 miles in 8 hours, and the answer key shows computing the unit rate by dividing the ratio 600:8 to get 75 miles per hour. Activity 1 has students write part-to-whole ratios for candy colors (e.g., 3:10) and use equivalent-ratio calculations to convert those ratios to percentages, demonstrating ratio manipulation and forming rates per one. The lesson's answer keys explicitly show the arithmetic steps for converting a ratio into a unit form (75:1) and for using equivalent ratios to find percent values.
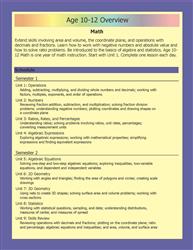
Unit 9: Skills Review
Lesson 2
Fractions, Ratios, and Coordinates
Students solve explicit unit-rate problems in Activity 2: they calculate the train's speed from 310 miles in 5 hours to find 62 mph (constant speed) and compute the unit price from a 3-pound bag costing $6.12 to find $2.04 per pound (unit pricing). The activity directions and parent notes state students may use division or equivalent-ratio reasoning, and the answer key shows the division steps used to find the unit rates.
Lesson 3
Expressions, Equations, and Percentages
Students work with given rates in story problems: in Activity 1 they write and evaluate an expression for Marie who makes $9 per hour and compute her earnings for 7 hours. In Activity 2 students write and solve an equation 5n + 3 = 18 to find how many hours Naomi babysat given $5 per hour plus $3. The skills list also explicitly states "Use ratio reasoning to convert measurement units" and the wrapping-up step directs students to practice percentages and unit conversions via an online quiz.
3: Math

Unit 1: Numbers
Lesson 1
Positive and Negative Rational Numbers
Students calculate and apply rates in multiple contexts: they multiply a rate by time to find totals (e.g., temperature drops 2.5°F per hour for 3.5 hours; a descent of 0.2 miles per hour for 6.5 hours), and they divide totals to find unit rates (e.g., a company loses $60 over 5 days to find average daily loss; a hiker climbs 600 feet in 4 hours to find feet per hour). Several activity pages ask students to write equations, solve for per‑unit quantities, and interpret quotients in real‑world terms (debt per person, average temperature change per hour).
Lesson 6
Scientific Notation
Students solve rate-style problems that require finding totals from rates and finding per-unit amounts using division. For example, Activity 6 asks students to compute total miles from a daily rate (2.5 × 10^2 miles/day × 30 days) and to compute liters per truck by dividing a total (4 × 10^5 liters ÷ 2 × 10^3 trucks). Activity 5 and other pages include problems that divide total production by days or trips (e.g., 6 × 10^4 kg ÷ 20 trips for kg per trip; 4 × 10^5 nails ÷ 2.5 × 10^4 nails/day for days needed). The fire-hose example (1.2 × 10^3 L/min × 60 min) has students multiply a unit rate by time to find a total amount.
Lesson 7
Arctic Marine Research
Students are given cell densities expressed as unit rates (1.2 × 10^8 cells per ounce and 9.5 × 10^7 cells per ounce) and are asked to compare the number of cells in equal tissue samples and find the difference. Students are also asked to compare cell lengths and compute how many times larger one cell is than another, practicing ratio and scaling between two quantities.
Final Project
Mars Station Test Mission
Students calculate energy use per hour, per day, and per year in Task 1 (heater energy converted from per-hour to per-day and per-year values). Students scale production rates in Task 2 by computing solar and wind output for 10 panels and 10 turbines and converting daily outputs to annual totals. Students use unit values to compute quantities in Task 3 by converting a fuel cell's energy (7 × 10^2 kWh = 700 kWh) and dividing an energy shortfall by that per-cell amount to find how many fuel cells are needed. The logistics tasks require students to apply unit pricing (cost per kg for supplies and $50 per meter of radius for drop zone cost) to compute total costs.
Unit 2: Proportions
Lesson 1
Proportional Relationships
Students set up and solve proportions for constant-speed scenarios such as "If you drive 60 miles in 1 hour, how far can you travel in 3 hours?" and multiple items like "A car travels 120 miles in 3 hours. How far will it travel in 5 hours?" Students solve unit-pricing and scaling problems such as "If 3 apples cost $1.50, how much would 9 apples cost?" and "If 7 gallons of gas cost $28, how much would 4 gallons cost?" The activities require students to write labeled ratios, use multiplication/division and cross-multiplication to find missing values, and apply these steps in real-world word problems.
Lesson 2
Unit Rates
Students calculate unit prices in multiple contexts (e.g., $4.99/6 apples → $0.83 per apple; pencils, sunscreen, internet plans, grocery items) and explicitly find unit rates for speed (e.g., 120 miles in 2 hours → 60 miles per hour; 8 laps in 20 minutes → 0.4 laps per minute). Students solve complex fraction division to get rates (e.g., (3/4) miles ÷ (1/2) hour → 1.5 mph) using Keep-Change-Flip and label units. Students apply unit-rate reasoning to multi-step and proportional problems (e.g., 240 miles on 8 gallons → scale to 15 gallons; brick-laying, recipe scaling, and other constant-rate word problems).
Lesson 3
Constant Rate
Students are taught the unit-rate formula k = y/x and repeatedly use it (Activities 2–5). They solve constant-speed problems such as "A car travels 60 miles in 1 hour; how far in 4 hours?" and cyclist/runner problems (Activity 6) that require finding a rate and using it to compute distance for a given time. Students compute unit prices and per‑unit values in multiple places: apples $3 per pound, cereal price-per-ounce comparison, 6 pens for $4 scaled to 15 pens, and price-per-pencil calculations on the review quiz. Students also create and solve their own real-world proportional problems (lemonade, recipes, shopping) and collect data to produce k = y/x in the optional extension.
Lesson 4
Graphing Proportions
Students compute and use unit rates in multiple places: Jim's dog‑walking table (Activity 2) has students find k = 12 and write y = 12x and graph points (0,0),(1,12),(2,24) etc. Several speed problems ask students to represent constant speed as a unit rate and list key points (e.g., Graph 1 and the 50 mph example, the Challenge with a car at 65 mph, train at 80 mph, and cyclists at 12/10/8 mph). Unit pricing and comparison tasks appear (pizza shops, t‑shirts, apples) where students find the cost per item and choose the best deal. The Skills Review and multiple activities require students to write y = kx, identify (1,k) as the unit rate, and use tables/graphs to scale quantities.
Lesson 5
Proportional Relationship Equations
Students are asked to compute and apply unit rates in multiple contexts: they write and use t = pn for unit pricing with movie tickets, apples, and soda (unit price per ounce) and complete tables for cost per item. Students compute and use constant speeds and rates in distance/time contexts (e.g., a train covering 210 miles in 3 hours, a car traveling 3/4 miles in 1/2 hour, and runner calories per minute), and solve equations like 156 = 10m and a = rh to find time or distance. The review and activity pages require students to find unit rates, write proportional equations (y = kx), and use those rates to predict totals or solve for unknowns.
Lesson 6
Taxes, Tips, and Commissions
Students set up and use formulas of the form amount = rate × quantity for taxes, tips, and commissions (e.g., Gratuity = Tip Percentage × Original Bill; Commission = Sales Amount × Commission Rate). Students solve forward percent problems (calculate tax, tip, or commission amounts) and backward problems by dividing to find unknown quantities (e.g., finding sales from a known commission: Sales = Commission ÷ Rate; finding price before tax by dividing total by 1 + tax rate). Several student activity problems require calculating totals after percent-based rates and reversing those calculations to find original amounts.
Lesson 8
Simple Interest and Percent Error
Students use the simple interest formula I = Prt to solve for missing values, including solving for the annual interest rate (r) and time (t) in multiple practice problems. Several activity pages require students to compute rates (e.g., finding r when I, P, and t are given) and to express interest rates as decimals. The percent error section includes a speed example (speedometer showing 60 mph vs actual 64 mph) that has students compute a percent difference involving a rate measurement.
Lesson 9
Unit 2 Test
Students are asked to compute unit rates directly in multiple problems (e.g., find the unit rate for 3/4 mile in 1/2 hour, 5/6 mile in 2/3 hour, and a car/trains traveling given miles in given hours). Students calculate unit pricing in concrete tasks (e.g., 3 shirts for $18, 4 muffins for $10) and find price per item. Students compute speeds from fractional distances and times (e.g., athlete/ cyclist problems) and read graphs to identify a unit rate (graphs through (0,0) and (2,8), Hours Worked vs. Money Earned).
Final Project
Lemonade Stand
Students are directed to compute unit prices for lemons by using a unit rate formula, record prices for individual and bulk options, and complete tables for 5, 10, and 20 lemons. Students calculate unit price per pound for sugar by dividing total cost by 2 and compute unit price per cup by dividing package cost by the number of cups. Students graph number of lemons versus total cost, interpret line steepness as price per lemon, and use proportions to find how many lemons and how much sugar are needed for a gallon and then divide total gallon cost by 16 to find cost per cup.

Unit 3: Expressions
Lesson 2
Rewriting Expressions
Students write and use expressions of the form Total Cost = Fixed Cost + (Variable Cost per Item × Number of Items) and solve problems that involve a per-item rate (for example, $3 per ride, $8 per hour, $10 per match). Several problems require students to set up and solve equations for the number of items or hours given a total cost (e.g., 25 + 3r = 58 → r = 11, and bike repair: $15 + $8 per hour → solve for hours). Activities on discounts, markups, and profit margins also have students multiply prices by factors (like 1.25 or 0.75), reinforcing the idea of a unit price or multiplier per one item.
Lesson 3
Algebraic Expressions
Students translate word problems about prices and counts into equations and solve for the unknown quantity (e.g., t = cp + s with 15 = 4p + 3 leading to p = 3). Students use unit-price reasoning for rides and items (e.g., s = r(m + t) with s = 2(6 + 12) and solving 36 = 2(6 + t) to find t = 12). Student activity pages (Movie Snacks, Concert Merch, Craft Supplies, Group Bowling) require subtracting a fixed cost then dividing by a unit cost to find the number of units purchased or used.
Lesson 4
Graphing Proportions
Students compute unit rates from real-world scenarios such as walking 6 miles in 3 hours (finding 2 miles per hour) and a car traveling 120 miles in 3 hours (finding 40 mph). Students find unit pricing from examples like $9 for 3 pounds of apples (finding $3 per pound) and problems on the activity pages asking for unit rates for pencils and apples. Students also use unit rates to compute totals for other quantities (e.g., if the unit rate is $3 per pound, then 4 pounds cost $12; if speed is 2 mph, then 2 hours -> 4 miles).
Lesson 5
More Graphing Proportions
Students calculate unit rates directly from tables and equations (e.g., Activity 2: 300 ÷ 5 = 60 mph and comparing to y = 70x). The lesson repeatedly has students identify unit rate as y when x = 1 and as the slope m in y = mx, then use those rates to compare speeds, prices, and other quantities (candy price per piece, streaming cost per month, faucet gallons per minute, etc.). Activities ask students to create tables and graphs from y = mx and to use those representations to determine totals for various x-values (examples: savings per week, marbles per second, gallons over minutes). Several tasks also pose applied questions about how long or how much (e.g., "how long would it take to fill a certain amount?" and "what happens to the total if you double the number of weeks?").
Lesson 7
Rise Over Run
Students draw right triangles between two lattice points, count the vertical "rise" and horizontal "run," and compute slope by simplifying the rise/run fraction. Students set up proportions comparing rise/run for different triangles to show that ratios are constant and that triangles are similar. Students complete many problems calculating slopes (for example +4/+4 = 1, (-)3/+4 = (-)3/4, +5/+3 = 5/3), practicing ratio and proportional reasoning that underlies rates.
Lesson 8
y = mx + b
Students are taught that slope (m) represents the rate of change and calculate m using m = (change in y)/(change in x) in activities where they find slope from two points and from tables. Students write and graph linear equations from real-world unit-rate contexts (e.g., y = 10x + 50 for hourly wage, road-trip cost y = 1.50x + 10, movie subscription and per-item pricing scenarios) and identify slope as dollars per hour or dollars per mile. Several activities require students to determine the slope from a table and use it to write y = mx + b and then compute and graph outputs for given inputs.
Lesson 9
Unit 3 Test
Students work with tables that map hours to earnings and days to cost (e.g., babysitting: 1 hr = $10, dog walker: 1 hr = $12, car rental: 1 day = $50, lawn care: 1 day = $60) and are asked to determine if relationships are proportional, find the slope, write the equation, and graph the data. Students are explicitly asked to interpret unit rates and slopes from tables and graphs (noted in the review checklist and parent plan) and to write and solve linear equations in contexts that combine a fixed fee and a per-unit charge (e.g., phone plan 30 + 10x = 80; rides and amusement park problems). Several problems require computing slopes from two points or extending lines through the origin, which has students practice identifying the unit rate as the slope and using it to generate equations like y = 10x or y = 50x.
Final Project
Planes, Trains, and Automobiles
Students fill tables of distance vs. time using given speeds (car 60 mph, train 80 mph, plane 400 mph) and write distance-time equations in the form y = mx. Students graph the three motions, compute rise/run for the train line (80) and interpret slope as a unit rate (speed). Students solve equations of the form 500 = m x to find travel time and write cost equations (y = mx + b) to compare cost per mile, using those slopes as unit pricing.

Unit 4: Probability
Lesson 3
Probability Models
Students calculate expected counts by multiplying a probability (a rate per trial) by a number of trials (for example, P(2) = 1/6 × 120 = 20 and 1/3 × 90 = 30). Students use proportional multiplication to predict outcomes (e.g., 75 × 1/2 = 37.5 to predict even rolls). Several activities ask students to make predictions by scaling a per-trial probability to many trials (coin flips out of 100, dice rolls out of 30/60/120, spinner draws out of 50/100).
Final Project
Happy Tails Dog Shelter
Students compute probabilities by dividing counts by the total (e.g., 3/60 × 100 = 5%) and build a probability model listing each size+color outcome and its percentage. They add probabilities across categories (e.g., total chance of meeting a medium dog = 30/60 = 50%) and run simulations with a 10-sided die to model how often small or large black dogs appear, recording average rolls until success. The activities require students to convert counts to fractions and percentages and to compare relative likelihoods based on those rates.

Unit 5: Functions
Lesson 1
What Is a Function?
Students learn that a linear function "changes at a constant rate" and see explicit statements like "Each time you increase x by 1, the y value increases by the same amount (in this case, it goes up by 2 every time)." Students compute outputs from linear rules (e.g., y = 2x + 1, y = -2x + 3) by filling tables and plotting points, and they practice matching tables to linear graphs. Students use input/output machines to evaluate rates of change numerically and graphically.
Lesson 2
Linear and Nonlinear
Students compute rate of change using the formula (y2 − y1)/(x2 − x1) in multiple tables and label relationships as linear when the rate is constant. Students work with explicit linear equations (e.g., y = 2x + 4) where they plug in x-values, complete tables, and observe that y increases by a fixed amount for each increase of 1 in x. A concrete unit-rate-like example appears (walking the dog: 100 steps per minute) and students graph and extend linear patterns, practicing prediction from a constant rate.
Lesson 3
Understanding Functions
Students are given step-by-step rate descriptions (e.g., Sylvia climbs 4 ft/hour for 3 hours, then 5 ft/hour for 2 hours) and are instructed to compute positions each hour and plot those points. Student activity pages (Timmy the Turtle, Bella's Balloon Ride) provide rates like 2 m/min and 6 m/min and ask students to create graphs from those rates. Graph-matching and interpretation tasks ask students to recognize linear straight-line graphs as constant rates (e.g., "Hours Worked" vs "Money Earned") and to describe when a quantity is increasing at a constant rate.
Lesson 5
Slope
Students calculate slope using the formula m = (y2 - y1) / (x2 - x1) and practice finding slope from two points, tables, graphs, and equations. The lesson explicitly states and uses interpretations like "the slope is 2 — every time x increases by 1, y increases by 2" and gives a "Slope from a Table in 3 Simple Steps" routine. Activities require students to pick two rows from a table and compute the change in y over change in x, and to read m from y = mx + b, which frames slope as a per-1 change.
Lesson 6
Slope-Intercept Form
Students compute slope as a rate from tables and points (e.g., in 'Table to Equation' they find m = 1/5 miles per minute and convert it to 0.2 miles/minute and 12 miles/hour). Multiple activities require students to find the rate of change from two points, from tables, and from graphs (Activities 1, 4, 6 and many Student Activity Pages). The lesson places these rate calculations in context (Ellie's subway trips), so students use slope to describe constant speed in a real situation.
Lesson 7
Creating Functions
Students compute rate of change as a unit rate from tables and graphs (e.g., the reading table showing 15 pages per hour and the slope formula used on the bike rental graph to get $3 per hour). Students identify per-unit costs in word problems and write linear function rules (examples: babysitting $7/hour → M=7h+5; lemonade $2 per cup; gas cost modeled as y=0.25x). Students use those unit rates to build equations that predict totals for different inputs (e.g., P=15h, C=3h+5), showing they scale quantities by the unit rate.
Lesson 8
Comparing Functions
Students compute unit rates from verbal descriptions and graphs (e.g., Alex: 1.5 miles/30 minutes → 0.05 miles/min; Bella: slope from (0,0) and (30,2) → 0.067 miles/min). Multiple activity problems require finding rates from tables, equations, and verbal descriptions (Rider A: 4 miles/20 minutes → 0.2 miles/min; Person A filling 12 gallons in 6 minutes → 2 gallons/min; bank accounts with slopes −10 and −10). Student tasks ask them to compare speeds, rates of loss, and starting values across representations and to use slope = Δy/Δx to find unit rates.
Lesson 9
Unit 5 Test
Students compute the rate of change from a time–distance table (Time: 1,2,3,4; Distance: 60,120,180,240) and write the rate as 60 miles per hour. Students write linear functions that express earnings per hour (E = 12h, E = 15h) and interpret those equations as unit rates. Students match distance–time stories (car at 40 mph, stop, then 60 mph) to appropriate graphs and compare slopes on subscription-cost graphs to identify which service increases fastest per month.
Lesson 10
Final Project
Students are asked to write and solve real-world rate problems on the Yellow Cards, including an example where Emma earns $10 for each hour babysitting and must write an equation and calculate earnings for 5 hours. The Blue Cards include story-style items that ask students to choose or write equations describing money earned per hour (e.g., start with $20 and earn $15 per hour). A Yellow Card example also describes a car driving steadily at 60 miles per hour and asks students to identify the slope and match to a graph, which addresses constant-speed interpretation.
Unit 6: Geometry
Lesson 1
Congruence and Similarity
Students calculate scale factors by dividing corresponding side lengths (for example, finding a scale factor of 6 ÷ 3 = 2) and then use that factor to find missing side lengths by multiplication or division (for example, 5 × 2 = 10 or x = 14 ÷ 2 = 7). Multiple activity pages ask students to find scale factors and to set up proportional relationships for pairs of similar shapes, and example problems show one shape twice as large as another (AB = 4, DE = 8, etc.). The lesson has students write and use proportional statements and corresponding-part mappings (e.g., AB → DE, AC → DF) to solve for unknown measurements.
Unit 7: Linear Equations
Lesson 2
Multi-Step Equations
Students set up and solve equations that use per-unit rates in real contexts (e.g., Running Track: 1.5 miles per day with 36 miles total to find number of days; Car Rental: $50 per day plus $0.25 per mile to find miles driven; Mr. Patel grocery example: $3 per pound of chicken to find pounds bought). Several problems require translating a "per" phrase into an equation (Catering $8.75 per guest, Phone Plan $0.15 per text, Contractor $85 per hour) and solving for a quantity using that unit price or constant-rate term.
Lesson 4
Multi-Step Word Problems
Students solve several real-world rate-style problems where a quantity is expressed as a base fee plus a per-unit rate (e.g., a van rental: $40 + $0.30 per mile, solved for miles; phone plans: $25 + $7/GB vs $10 + $8/GB, solved for GB). Students compare hourly rates in a problem that asks after how many hours two mowing/weeding offers yield equal earnings. Multiple problems require translating per-unit pricing or per-hour rates into linear equations and solving for the unknown.
Lesson 7
The Point of It All
Students solve word problems that involve a flat fee plus a per-mile fee (delivery service) and a flat fee plus an hourly rate (babysitting), requiring them to set up and solve linear equations for miles or hours. Students find slopes from two points and write equations in slope-intercept form (y = mx + b), which gives practice computing a rate (m) from given data. Several activity pages require translating rate contexts into equations and solving for an unknown quantity in context.
Lesson 8
Linear Algebra In the Wild
The lesson introduces and uses the formula Distance = Rate × Time and has multiple motion problems and activity pages that ask students to define x (hours or distance) and y (total cost or distance) and solve for unknowns using rate×time. The candy-shop example has students solve systems to find price per pound (unit pricing), and the apple/bag examples compare per-item cost versus bulk price to find a break-even quantity. Several student problems and worksheets explicitly set up y = rate·x (or cost = rate·quantity + fixed fee) and solve for x or y, practicing calculations with rates and unit prices.
Lesson 9
Unit 7 Test
Students solve several word problems that use rates and unit pricing: e.g., Jamie earns $12 per hour plus a $50 bonus and students solve 12h + 50 = 122 to find hours; a gym problem uses $25 per month + $5 per class to find number of classes; lemonade sold at $2 per cup and ticket problems ask for cost per ticket. Students set up and solve linear equations from these rate-based contexts to find quantities (hours, number of classes, number of cups, or unit prices). Multiple answer keys show students performing the algebra to isolate the unknown in rate equations.
Final Project
Getting Ready for College
Students set up and solve per-unit cost equations across multiple activities: they write C = 225 + 0.60x and C = 1.25x for transportation and solve for the break-even miles, and they write C = 5 + 1.5h and C = 20 for streaming and solve for break-even hours. In the meal-plan and groceries activity students determine slopes (cost per week) from graph points (e.g., $80/week and $50/week) and write equations like C = 80w and C = 100 + 50w. Phone-plan and housing tasks have students compute and compare per-unit rates (per GB, per month) and use those unit costs in tables, graphs, and break-even calculations.

Unit 8: Data
Lesson 2
Scatterplots
Students examine linear relationships that represent rate-like situations (for example, a labeled graph 'Hours Spent Driving' vs. 'Miles Driven') and draw or choose best-fit lines to make numeric predictions. Multiple activities ask students to draw best-fit lines and then estimate values for a given input (e.g., predict calories burned for 45 minutes, predict miles or scores for a given hours/value). The Making Predictions section explicitly guides students to extend best-fit lines beyond data to estimate outcomes for new x-values.
Lesson 3
Constructing a Scatter Plot
Students plot pairs of quantities that involve hours (e.g., Study Hours vs. Practice Problems, Hours of Art Practice vs. Completed Sketches, Minutes of Exercise vs. Resting Heart Rate) and draw best-fit lines to determine trends. Several activity questions ask students to make numerical predictions for a given time (for example: predict problems solved for 5 hours, sketches at 9 hours, resting heart rate at 80 minutes, ice creams sold at 100°F), and one image text states "each additional hour studied corresponds to approximately a 10% increase in test grade." These tasks require students to use a rate-like slope of a linear relationship to estimate outcomes.
Lesson 4
Linear Models
Students identify slope as a rate of change and interpret it as a change in the dependent variable per one unit of the independent variable (e.g., "slope (m = 2) means for every 1°F increase, 2 additional ice cream cones are sold"). Students compute slopes from data (bird migration sample computes 10 ÷ 4 = 2.5 birds per day) and use those unit rates in equations to make predictions (substituting x=10 to predict 70 cones at 70°F, calculating fuel left after driving 5 hours, predicting plant height after 5 weeks). Numerous practice problems require students to write slope-intercept equations from scatterplots and solve for quantities at given x-values using the per-unit rate.
Lesson 5
Categorical Data
Students compute relative frequencies by dividing cell counts by row or column totals (e.g., Activity 4 computes 18/90 = 0.20 for bikers who caught a cold). Activities 5 and Day 3 direct students to convert frequency table entries into row- or column-based relative frequencies and to express those results as decimals or percentages. The materials ask students to use proportional reasoning to compare groups and interpret what the proportions mean when comparing categories.
Lesson 6
Unit 8 Test
Students are asked to match an equation to a scatterplot that shows hours of biking vs. distance traveled (Question 13 asks students to choose between y = 2x + 4 and y = 4x + 0). Several items require writing or selecting linear equations from scatterplots (e.g., questions that result in y = 4x + 2, y = −8x + 40), which requires interpreting slope as a rate. The Parent Plan explicitly describes using the equation of a linear model to solve problems and gives an example interpreting a slope as 1.5 cm/hr, indicating students practice interpreting slope in units of per-hour rates.
Final Project
Collecting and Organizing Data
Students are instructed to create scatterplots, plot paired numerical data (e.g., jumping jacks vs. heart rate), and ‘informally fit a straight line' or a line of best fit. The parent-plan explicitly states students will "use the equation of a linear model to solve problems in the context of bivariate measurement data, interpreting the slope and intercept," and gives an example interpreting slope with units (1.5 cm/hr). Activity pages ask students to analyze trends and describe relationships (e.g., as jumping jacks increase, heart rate increases), which requires thinking about rate of change between two measured quantities.

Unit 9: Semester Exams
Lesson 1
Numbers Review
Students divide totals to find a per‑unit amount in questions such as "A gamer loses 45 points over 9 rounds" (−45 ÷ 9 = −5, meaning −5 points per round) and "A debt of $72 is split evenly among 6 friends" (−72 ÷ 6 = −12, meaning $12 per friend). Students work with a rate given per time in the temperature task (−2.5° per hour for 6 hours) and compute total change by multiplying the unit rate by time (−2.5 × 6 = −15). The activity also asks students to create real‑world problems that use multiplication or division with fractions or decimals, which can involve forming or using unit rates.
Lesson 2
Proportions Review
Students compute speeds and unit rates directly (Activity 1 asks: a cyclist rides 3 miles in 12 minutes — what is the speed in miles per hour?). Students find unit price/type rates from quantities (Activity 1: 2 cups of flour for 5 batches → cups per batch; Activity 1 asks students to compare runner A and B by computing miles per hour). Students use proportional equations and graphs to find totals from unit rates (Activity 3 has students graph y = 6x, interpret (1,6) as a unit rate, and Activity 4 asks students to use a map scale 1 inch = 6 miles to find miles for 9 inches).
Lesson 3
Expressions Review
Students compute and interpret unit rates in multiple activities: Activity 2 asks students to find the unit rate (slope) from a babysitting table (1 hr → $14) and from a car rental table (1 day → $75), write equations like y = 14x and y = 75x, and graph the relationships. Activity 3 and Activity 4 require students to write equations for situations with per-hour charges or wages (tutoring $40/hr, delivery $18/hr + $12 fee, Job A: $18/hr vs Job B: $12/hr + $20) and to compute and compare totals after specified times (e.g., who earns more after 3 hours, costs after 4 months). Several tasks explicitly connect slope to unit rate and ask students to use that rate to find values and compare rates.
Lesson 5
Semester Exam
Students calculate unit rates in multiple problems: they find miles per hour from "4/5 mile in 1/2 hour" (Problem 14) and from "18 miles in 3 hours" (Problem 15). Students extract unit rate from a graph that passes through (0,0) and (2,10) (Problem 19) and compute unit rate and equation from "6 miles in 1.5 hours" (Problem 34). Students apply unit rates to solve quantity or cost problems such as converting a scale (1 inch = 4 miles → 7 inches = 28 miles) and computing cost for 3 movie tickets using a per-ticket price (Problem 33).
Lesson 6
Functions Review
Students calculate slopes from two points and interpret slope as a rate of change (Activity 3: find slope from (2,1) and (6,9) and explain meaning). Students write functions for per-hour contexts and identify the slope as a unit rate (Activity 4: write y = 18h for $18 per hour; bike rental y = 12x + 10). Several contextual problems ask students to interpret intercepts and per-unit charges (taxi starting fee plus per-mile charge, bike rental per hour). Students also compare rates by finding and comparing slopes of given functions (Function A vs. Function B).
Lesson 8
Linear Equations Review
Students set up and solve linear equations from word problems that include per-unit fees and rates: e.g., a gym charging $25 plus $15 per month, a streaming service charging $12 plus $3 per movie, and a taxi charging $6 plus $2 per mile; students solve these to find months, movies, and miles. Students compute slopes from two points (e.g., slope = 2 and slope = -2) and graph lines in slope-intercept form, practicing interpretation of slope as a rate of change. Students also solve ticket and price-combination problems (student/adult tickets, ride/game tickets) that require reasoning with unit prices.
Lesson 9
Data Review
The Parent Plan lists the skill "Use the equation of a linear model to solve problems, interpreting the slope and intercept" and gives an explicit example interpreting a slope as "1.5 cm/hr," which connects slope to a rate with units. Activity 3 asks students to analyze scatterplots, interpret trends, and consider lines of best fit (including a linked video titled "Write an Equation for a Line of Best Fit"), so students practice interpreting linear relationships and what closeness to a line implies.
Lesson 10
Semester Exam
Students write a rate-based function in problem 8 (You earn $10 per hour. Write a function that represents your total earnings), and they solve a time-rate word problem in problem 35 (tutor charges $18 per hour plus a $30 fee; solve for hours when total cost is $138). Students also compute slope between two points in problem 5 (slope = 2), which represents a constant rate of change. The answer key explicitly shows y = 10x and the numeric solution 6 hours for the tutor problem.