


Sixth Grade - MATH
5: Math
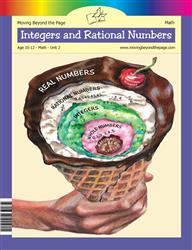
Unit 2: Integers and Rational Numbers
Lesson 1
Fraction Addition and Subtraction
Activity 5 and its Parent Plan explicitly direct students to learn and practice plotting fractions on a number line by completing an interactive "Fractions on a Number Line" tutorial and playing the accompanying Number Line game. The lesson tells students to explore how to accurately plot a fractional point on a number line and then apply number-line skills in related problems (Activity 5 problem set and the Fractions Number Line Tutorial link). Several problem items ask students to read measurements on a ruler or locate fractional points (e.g., Finn measures his fishing lure; Olivia's measuring cup question), which requires placing fractions on a number line or scale.
Lesson 4
Negative Numbers and Integers
Students work with both horizontal and vertical number lines: the lesson includes labeled horizontal and vertical number line images and directs students to mark values (for example, plot +4 and -4) and to plot numerical answers on a number line foldable. Students are asked to estimate and place large integers on a scaled number line (example showing -300 to 300 with dots at -200 and 200) and to shade positive and negative regions. The lesson also presents and asks students to classify decimals and fractions (e.g., -3.5, 38.5, -6.4, -8/13) and to include these rational numbers in diagrams and activities.
Lesson 5
Absolute Value and Inequalities
Students are asked to plot pairs of numbers on number lines in the "Number Lines and Distances" activity (examples include integer pairs like -3 and 2 and rational pairs like 2 1/2 and 6, 4 1/2 and 2 1/2). The "Absolute Value Notes" directs students to label marks from -6 to 6 and to identify positions and distances, and the "Inequality Notation" activity has students plot and compare -3 1/2 and -4 on a number line. The parent/intro text and Activity 1 explicitly refer to using a vertical number line to represent above/below ground (positive/negative) positions.
Lesson 6
The Coordinate Plane
Students plot numbers on horizontal number lines in Activity 3 (e.g., plot 6 and -6) using number lines labeled -10 to 10. The Reflecting Points activity asks students to plot and find opposites for non-integer rationals (3 1/2, -4.5) on horizontal and vertical number lines. Activities 1–2 and the Student Activity Pages have students find and position many ordered pairs (e.g., (5,2), (-5,3), (6,-5), (-4,-4), 4.5, 2.5) on coordinate grids and practice plotting, moving, and labeling points in all four quadrants.
Lesson 7
Coordinate Problem Solving
Students plot and label integer ordered pairs on coordinate grids (examples include (7, -3), (2, -3), (-3, 5), (4, 2), (-4, -4)) and use axes labeled with negative and positive values. Students practice placing points in all four quadrants and writing their coordinates (Activity 3 requires creating drawings using points in all four quadrants). Students find horizontal and vertical distances by counting along the x- or y-axis (several problems ask for horizontal/vertical distances and use absolute value to report positive distances).
Lesson 8
Unit 2 Test
Students are asked to plot integers on horizontal number lines (e.g., problems that direct students to plot 2, -1, 4, -3 and another that plots -4, -2, 1, 2, 3 on a number line). Students plot and manipulate ordered pairs on coordinate grids (multiple exercises 18–21 ask students to plot points such as (2,7), (3,6), (-5,2), (4,-3), (3,3) and to perform translations and reflections). Students also determine quadrants for given points (e.g., identify the quadrant for (2, -2), (-4, 7), (-1, -6), (3, 8)) and compute horizontal and vertical distances between coordinate pairs (problems asking for the horizontal and vertical distances between (4, -6) and (-2, 1)).
Final Project
Coordinate Game
Students work with a coordinate grid labeled from -12 to 12 on both axes with tick marks at every integer, and are instructed to sketch and position their playing pieces within a chosen quadrant. Students call out pairs of x-y coordinates to indicate locations in an opponent's quadrant and mark those points as hits or misses on their grids. Students must place targets that occupy specified numbers of coordinate points (e.g., a target covering 5 coordinate points), requiring them to locate and mark multiple integer coordinate points.
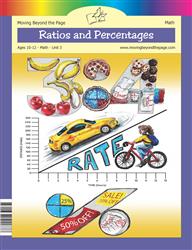
Unit 3: Ratios and Percentages
Lesson 3
Equivalent Ratios
Students are asked to fill tables and plot ordered pairs on coordinate-plane graphs (e.g., plotting (1,6), (3,18), (5,30) and identifying the point (4,24)) and to draw a line through plotted points (Activity 3 and related problems). Students use double number line diagrams to place and scale integers for equivalent-ratio problems (Activity 2 and multiple examples). The Basic Skills review asks students to locate/identify a point with a negative x-coordinate (the point (-5, 3) and its quadrant), requiring positioning of an integer pair on the coordinate plane.
Lesson 4
Unit Rates
Students are asked to use double number line diagrams to solve ratio problems (Activity 6 asks students to "Solve using a double number line diagram"). Students are also asked to create a graph from a table of hours vs. calories (Uri's table: (1,150), (3,450), (6,900)) and answer questions based on the graph, which requires plotting ordered pairs on axes. The lesson presents and uses rational unit-rate values (e.g., 2.5 cups, $0.14 per egg) in computations that could be represented numerically on a number line or graph.
Lesson 6
Percentage Problems
Students create and use double number line diagrams to model percentages and equivalent ratios, placing given part and whole values on the lines (for example, mapping 15→100 and 45→300 and using the lines to find missing values). Student activity pages explicitly instruct students to "Find the missing number in each problem using a double number line to make equivalent ratios" and provide multiple problems where students place percent and quantity values on those lines. The lesson shows worked examples and an answer key that place numerical values on the double number lines to compute parts, wholes, and percents.
Lesson 8
Unit 3 Test
Students are asked to complete tables of equivalent ratios and then plot the pairs of values on a coordinate grid (e.g., the apples vs. pies activity with points (10,3), (20,6), (40,12)). Several student pages require graphing relationships (Models vs. Hours) on a labeled coordinate plane and answering questions from the graph. The skills list explicitly tells students to make tables of equivalent ratios, find missing values, and plot the pairs of values on the coordinate plane.
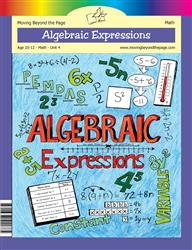
Unit 4: Algebraic Expressions
Lesson 4
Positive and Negative Numbers
Students repeatedly use horizontal number line diagrams (e.g., number lines from -10 to 10 and -12 to 12) to identify locations and distances from zero, find opposites (additive inverses), and evaluate expressions by counting left/right on the line. Student activity pages instruct students to "use the number line as reference" for finding opposites, rewriting subtraction as "add the opposite," and evaluating results (examples: 12 - 4 = 12 + (-4); practice problems and answer keys use number lines for solutions). The Parent Plan and activities explicitly require students to represent addition and subtraction on number line diagrams and to show that distance between two rational numbers is the absolute value of their difference.
Lesson 7
Unit 4 Test
The Parent Plan skills list explicitly asks students to "show that the distance between two rational numbers on the number line is the absolute value of their difference" and to "understand subtraction of rational numbers as adding the additive inverse," which directly relates to number-line reasoning. Several student problems require work with negative numbers and subtraction of negatives (for example, -14 - (-9), 20 - 36, 35 - (-7)), and web links point to integer games (Orbit Integers, Fruit Splat) that practice integer reasoning. The materials repeatedly address understanding positive and negative numbers used together to describe opposite directions or values.
Unit 5: Algebraic Equations
Lesson 2
Solving One-Step Equations, Part 1
The Basic Skills Review includes a coordinate-plane item that asks students to plot the point (3, -4) and identify its quadrant, and an accompanying image shows a coordinate grid with a plotted point and quadrant label. The review instructions explicitly prompt students to use the small coordinate grid for problem 10. These items provide direct practice with placing at least one ordered pair on a coordinate plane and identifying its quadrant.
Lesson 5
Inequalities
Students represent solution sets on horizontal number lines by drawing open or closed dots and shading arrows to show all numbers greater than or less than a given value. Students place integer values and negative integers on labeled horizontal number lines (examples use −10 to 10) and write solution sets that list integers and note that decimals and fractions between integers are also included. Students translate between number line graphs and inequality notation by drawing graphs from inequalities and writing inequalities from given horizontal number line graphs.
Lesson 6
Solving Inequalities
Students are instructed to graph solution sets on number line diagrams (multiple activity pages specify a number line from -8 to 8 and ask students to "Graph the solution set on a number line"). The Parent Plan and skills list explicitly state that students will "Represent solutions of inequalities on number line diagrams" and the answer key describes students placing open or closed dots and arrows at solution values (for example open dot at 3 with arrow right). Problems require solving inequalities that produce integers, decimals, and fractions (e.g., n/3 ≤ 1, x<- 2.6 < 2.4, (2/3)p ≥ 4), which students then graph on the horizontal number lines.
Lesson 7
Independent and Dependent Variables
Students are shown and use Cartesian coordinate grids with labeled axes ranging from negative to positive values (examples include grids labeled -6 to 6 and -10 to 10) and are given tables of (x,y) pairs such as (-2,0), (1,3), (0,2), (2,4) to plot. Activities ask students to create input/output tables and then plot the resulting ordered pairs (e.g., y = x + 2, 2x + 1 = y, y = x - 2) and to identify solutions in specific quadrants, including examples that mention fractional/decimal pairs (e.g., (1.5, 3.5)). One-variable number lines are used earlier for graphing single-variable solutions and inequalities, giving students practice placing integer solutions on horizontal number lines.
Lesson 8
Unit 5 Test
Students solve inequalities and are asked to graph their solution sets on horizontal number lines that are explicitly shown from -8 to 8 (several Student Activity Pages require plotting solutions with open/closed dots at integer locations such as -2, 2, 3, -5). Students create tables of ordered pairs and plot those pairs on coordinate grids for linear equations (tasks include x - y = 8 with provided pairs like (0, -8), (4, -4), (8, 0) and the equation y + 5 - 2x = 6 rewritten as y = 2x + 1 with a table of points and a graphed line). Students are asked to name a point that is and is not a solution to the graphed line, which requires locating and judging ordered pairs on the coordinate plane.
Final Project
All About Me
Students are instructed to include at least one inequality that is shown on a number line and an example image shows an inequality graphed on a horizontal number line (values greater than 5 on a -8 to 8 line). The project requires students to create equations and inequalities including fractions and decimals, so students solve problems that involve rational numbers. The checklist and steps ask students to represent solutions (for example, plotting an inequality) and to include diagrams (tape/hanger) that accompany algebraic expressions.
Unit 6: 2D Geometry
Lesson 3
Triangles
Students are asked to use a laminated coordinate plane and given specific coordinates (for example (1,1), (-1,-1), (-2,2), (1,-2), (-3,-5), (-6,-5), (4,2), (8,2)) to draw triangles in different quadrants. Activities require students to draw horizontal and vertical line segments of specified unit lengths from given coordinate points and to connect endpoints to form triangles. The student pages ask for students to give coordinates for dots, draw triangles on the grid, and compare triangles created from those coordinate pairs.
Lesson 4
Area
Students work with a kite drawn on a coordinate grid with vertices given as (4, 3), (6, 5), (8, 3), and (6, 1) and are instructed to divide it by a vertical or horizontal line and count grid units to find bases and heights. Several student activity pages include a coordinate plane with a plotted polygon and ask students to find the area by counting grid units and decomposing into triangles/rectangles. The lesson explicitly has students read grid-based coordinates and use unit counts on the axes to compute dimensions for area calculations.
Lesson 6
Scale Drawings
Students use a coordinate grid in Activity 2 to draw rectangles with specified lengths and heights and label them as original, enlargement, and reduction; an image shows rectangles with explicit corner coordinates (for example, bottom left at (3,4) and top right at (7,6)). The Basic Skills Review asks students to determine coordinates of a point reflected across the x- and y-axes, which requires identifying and using integer coordinate pairs. The Skills list also includes "Draw polygons in the coordinate plane," indicating student practice placing shapes on a coordinate grid.
Lesson 7
Unit 6 Test
Students are asked to use coordinate grids to draw triangles (e.g., "Use the grid to draw an obtuse scalene triangle" with axes labeled 0 to 18 and "Use the grid to draw a right isosceles triangle" with coordinates provided). Trapezoids and triangles are presented on grids and students identify corresponding sides and angles between figures drawn on those grids. Several tasks require drawing scaled figures on grids (scale drawing problems involving grids and right triangles).
Unit 7: 3D Geometry
Lesson 2
Surface Area
Students are asked to graph the inequality y < 2 on a number line (Problem 3) and an image shows a horizontal number line with an open circle at 2 and shading to the left. Students are also asked to graph points on a coordinate plane at (3, 2), (-3, 2), (-5, -1), and (1, -1) (Problem 5a) and an image of a coordinate plane with plotted vertices is provided. The answer key explicitly describes graphing the inequality on the number line and plotting the listed integer coordinate pairs.
Lesson 5
Problem Solving With Solids
Students encounter a coordinate-plane task in the Basic Skills Review where a graph shows point A(3, 2) and they are asked to find the coordinates after reflecting A over the y-axis; the answer key explicitly gives the original and reflected integer coordinates ((3, 2) → (-3, 2)). The Basic Skills Review also includes operations with integers (e.g., 8 + (-15) + 4 - 7 + 10) which gives students practice with integer values used in contexts. The materials explicitly reference a graph with a marked point and ask for new coordinates after a transformation, so students work with ordered integer pairs on a coordinate plane at least once.

Unit 8: Statistics
Lesson 2
Populations and Samples
Students are asked to solve the inequality n + 3 < 5 and graph the solution on a horizontal number line (Problem 7), using a number line labeled from -5 to 5 where they place an open dot and shade left. The Basic Skills Review contains problems with integers and fractions (e.g., evaluating expressions and adding fractions), which gives students practice working with rational numbers even if not always on a number line.
Lesson 3
Frequency Tables and Dot Plots
Students are asked to draw and label a horizontal number line (for example, Dog Heights from 10 to 34) and place a dot above each whole-number measurement according to the frequency table. Student activities require arranging numerical data in order and converting those counts into dot plots by placing one dot per data value at the corresponding integer mark. Several activity pages ask students to create dot plots with labeled axes and to read counts from marks on a horizontal number line.
Lesson 5
Histograms
Students place class-size values on a labeled horizontal number line (Activity 3) and create dot plots that place numeric data values as dots along that number line. The Skills section explicitly lists "Display numerical data in plots on a number line, including dot plots, histograms, and box plots," and several student activity pages require organizing numerical data (integers) into frequency tables and plotting them on axes. Students also construct histograms with horizontal axes showing numeric intervals and vertical axes showing frequency, which requires positioning numeric interval endpoints along a horizontal axis.
Lesson 6
Measures of Center
Students convert graph data into ordered lists and place those values on horizontal number lines and dot plots (for example, they list the swim team ages and write them in order: 12, 12, 13, ... 17 and circle the median 15). Several images and activities show data points plotted along a horizontal number line (Golf Team Practice Time hours, Swim Team Ages dot plot, and other dot-plot/number-line displays). Activity prompts ask students to list data values from frequency tables and dot plots and to use those ordered values to find and mark measures of center on a line.
Lesson 7
Measures of Variability
Students are asked to create number lines and to construct box plots by placing dots for the minimum, maximum, median, 1st quartile, and 3rd quartile on a horizontal number line (e.g., the Constructing a Box Plot Notes with a number line from 6 to 16 and the box-plot activities for windows, cars, water usage, and test scores). Activities instruct students to put data values in order, create a number line that fits the values, and mark specific numeric summary points on that line. Several student pages require plotting those summary values and interpreting their positions on the horizontal axis.
Lesson 8
Making Inferences
Students work with a coordinate grid in the Basic Skills Review (#10) where points A and B are shown on the grid and questions ask for the horizontal and vertical distances between A and B. The answer key lists the coordinates A(3, -2) and B(-4, 2), indicating students interpret ordered pairs and use the coordinate plane to determine distances. Several activities require reading data from plots (dot plot, histogram, box plot), which involves interpreting values along horizontal axes.
Lesson 9
Comparing Populations
Students create stacked dot plots and place data values on horizontal number lines (e.g., blank graphs labeled "Number of Zucchini" from 0 to 8) and plot pumpkin weights and zucchini counts on horizontal axes. The lesson includes bar graphs and histograms with x-axes labeled by numeric intervals (heights in inches) where students interpret and position data within those horizontal intervals. Students compute and plot mean-related distances in tables that reference positions relative to the horizontal number line values.
Lesson 10
Unit 8 Test
Students are asked to create dot plots (e.g., "Number of Pool Uses," "Favorite Day to Visit the Movie Theater") which requires placing integer data values above labeled numbers on a horizontal number line. Students are instructed to create box plots using a provided horizontal number line (range 10 to 56) and to place the five-number summary on that axis. Several activities (dot plots, histograms, stem-and-leaf) require students to locate and represent integer data values or grouped numeric ranges on horizontal axes.
Final Project
Statistical Study
Students are instructed to create dot plots that include a number line with an appropriate number range and to draw box plots with clearly labeled five-number summaries (minimum, Q1, median, Q3, maximum). The directions require students to organize numerical data (including lists ordered smallest to largest) and to place individual data values on dot plots or histograms. The parent notes and Step 4 explicitly require students to compute mean, median, quartiles and then display those numerical values on graphs.
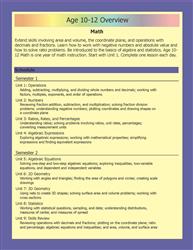
Unit 9: Skills Review
Lesson 2
Fractions, Ratios, and Coordinates
Students practice plotting points on a coordinate grid by playing the four-quadrant Graphing Puzzle game and by completing the 'Coordinate Plane' activity that asks them to plot points such as (-2, 4), (3, 5), and (-3, -2), reflect a point across the y-axis, and compute vertical/horizontal distances. The Parent Plan and activity descriptions explicitly instruct students to plot coordinates, draw simple figures, and solve problems by graphing points in all four quadrants of the coordinate plane.
Lesson 3
Expressions, Equations, and Percentages
Students solve the inequality n + 2 > 5 and graph its solution on a provided horizontal number line, placing an open dot at 3 with an arrow to the right. The activity includes a number line from -9 to 9 for graphing inequalities and the Skills list asks students to represent solutions of inequalities on number line diagrams. The answer key describes the graph (open dot at 3, arrow right), showing students practice positioning a point and shading a solution set on a horizontal number line.
3: Math

Unit 1: Numbers
Lesson 1
Positive and Negative Rational Numbers
The lesson includes multiple horizontal number line images (e.g., a number line from -8 to 8 and from -5 to 5) that students use to visualize position and movement. Several activities ask students to draw movements on a number line, circle zero pairs, and represent scenarios with number-line diagrams (Activity 1 student pages and examples). Students are prompted to use number lines or diagrams to explain multiplication and division of signed numbers (Activity 2 challenge, Activity 4 temperature/submarine examples).
Lesson 2
Fractions and Decimals
An opening image displays a horizontal number line marked between 0 and 1 with points labeled at 1/4, 1/3, and 1/2, each shown with both fraction and decimal notation, so students see rational numbers positioned on a number line. Multiple activities require converting fractions to decimals and vice versa (including practice pages and examples), which supports understanding the numeric values that could be located on a line. The Review Quiz includes context problems about positive and negative values (e.g., a scuba diver descending and ascending) that invoke position-relative thinking with integers.
Lesson 5
Irrational Numbers
Students identify nearest perfect squares and use integers as landmarks to estimate and place square roots on horizontal number lines (Activities 4–6 and Activity 5 number-line tasks). Students compare and order numbers by squaring and use squared values to determine inequalities (Activity 3), and several student pages ask them to place approximated values (e.g., √30, √50, √18) on provided number-line segments. Students also work with decimals and fractions in sorting activities, reinforcing number categories that relate to positioning on a number line.
Lesson 8
Unit 1 Test
The Parent Plan explicitly tells students to "use rational approximations of irrational numbers to compare the size of irrational numbers, locate them approximately on a number line diagram," and the Introducing the Lesson section repeats that students should "show where [irrational numbers] would go on a number line." Student problems ask students to compare and order numbers (e.g., √36, 5.5, 6.1), determine whether square roots are rational or irrational (e.g., √50, √45), and approximate square roots to given precisions, which supports locating values on a number line. Several word problems with negative depths and operations with negatives (e.g., submarine/diver problems, sums of opposites) give practice with integers and their ordering.
Unit 2: Proportions
Lesson 3
Constant Rate
Students work with graphs that show Cartesian axes (e.g., axes labeled from -5 to 5 and -6 to 6) and are asked to pick points on those lines (examples include points such as (2,2) and (4,4)) to compute the constant k = y/x. Activities ask students to decide whether a graphed line is proportional by checking that it passes through the origin and to identify ordered pairs from the graph to use in calculations. Several student pages present diagonal lines on a coordinate grid and prompt students to find k using coordinates of points on the line.
Lesson 4
Graphing Proportions
Students are asked repeatedly to plot ordered pairs on coordinate grids (e.g., plot (0,0), (1,12), (2,24), (3,36), (4,48) for Jim's earnings) and to build tables of values from equations and then graph those points (Day 2 and Day 3 activities). The materials include plotting negative and fractional/decimal values (examples show points like (-2,-4), (-1,-2), (0,0) and unit rates such as 0.2 and 1/4), and students label the horizontal x-axis and vertical y-axis before plotting. Multiple activities require students to determine whether a line passes through (0,0), draw straight lines on the coordinate plane, and interpret points such as (1,k) and (0,0) in context.
Lesson 5
Proportional Relationship Equations
Students are asked to read and interpret graphs that show proportional relationships (e.g., questions asking whether a graph represents a proportional relationship and what the point (1,5) means). Students create and use graphs for scenarios such as the theme-park ticket challenge and tank-filling comparison, and they read plotted points on a provided graph with axes labeled 0 to 6. The review activities emphasize that proportional graphs are straight lines through the origin and ask students to determine unit rates from graphs.
Lesson 9
Unit 2 Test
Students are asked to graph equations (e.g., "Graph the equation y = 4x" and "Graph the equation y = 5x") and to plot and interpret points such as (0, 0), (1, 4), (8, 36), (15, 60), and (2, 8) on provided coordinate grids. Several problems ask students to decide whether a set of plotted points or a graphed line is proportional (straight line through the origin) and to explain what specific points represent in a proportional context. Blank graphs and explicit plotting tasks require students to position ordered pairs of integers and rational numbers on a coordinate plane.
Final Project
Lemonade Stand
Students are asked to create graphs with the number of lemons (x) on the x-axis and total cost (y) on the y-axis, label axes, and plot lines for each store (Step 3). In Part 2 students fill tables and graph cups versus tablespoons, write equations in the form y = kx, and the answer key shows points plotted on a grid from (0,0) to (16,32). Part 3 and other sections require students to compute decimal unit prices and proportions and then use those values in graphs and cost-per-cup calculations, implying plotting and interpreting ordered pairs of numeric values.

Unit 3: Expressions
Lesson 4
Graphing Proportions
Students create tables of values and plot ordered pairs on coordinate grids (e.g., Activity 3 asks students to plot (0,0),(1,3),(2,6),(3,9) from y=3x). Students choose points from given graphs and write equations by dividing y by x (e.g., Activity 4 uses points like (4,10), (5,15), (3,7.5), (6,-18)). Multiple activity pages require plotting lines that pass through (0,0) and other integer or rational-coordinate points (e.g., graphs with (0,0) and (2,8), (0,0) and (4,12), and tasks in "Walk the Graph" that use fractional and decimal steps).
Lesson 5
More Graphing Proportions
Students create tables of values and plot ordered pairs on blank coordinate grids throughout the lesson (e.g., plotting points like (1,3), (3,5), (6,10), (1,0.6), and (1,-3)). Multiple activity pages ask students to label x- and y-axes, choose scales, and graph equations in the form y = mx, explicitly directing students to plot points from tables and equations and to draw lines through those points. Several problems require plotting two relationships on the same coordinate plane to compare slopes (e.g., graphing y = 4x and y = 3x, or y = 0.6x and y = x).
Lesson 6
Intercepts
Students identify x- and y-intercepts as ordered pairs (for example (3,0), (0,-2), ( -4,0 ), (0,5)) and write those coordinates on coordinate grids. Students solve equations algebraically by setting y = 0 or x = 0 (e.g., 2x + 4y = 8) to find intercept values and then plot those points on blank coordinate planes. Several activities ask students to graph lines using given intercepts (e.g., Line E: (2,0) and (0,4); Line G: (-5,0) and (0,5)), so students position pairs of numbers on the coordinate plane.
Lesson 7
Rise Over Run
Students work with labeled coordinate grids and choose lattice points (e.g., (2,3), (6,7)) to draw right triangles and count horizontal and vertical movements. The activities include plotting and using pairs of integer coordinates (including negatives such as (-4,1), (-5,-1)) on the coordinate plane to calculate rise and run. Student pages repeatedly require filling in rise/run and computing slopes from movements along the x- and y-axes.
Lesson 8
y = mx + b
Students repeatedly plot ordered pairs and intercepts on coordinate grids labeled from -10 to 10 in multiple activities (e.g., Activity 1, Activity 3, Activity 5, Activity 6). They use two-point formula with given points to calculate slope and then plot and extend the line through those points (Activity 5 and Extend the Line pages). Students graph horizontal and vertical lines (y = 1, x = 3) and graph lines with rational slopes such as 1/2 and -3/2, using rise/run to position points precisely.
Lesson 9
Unit 3 Test
Students are asked to graph data from tables (e.g., hours vs. earnings, days vs. cost) on blank coordinate grids and to write equations from those tables, requiring them to place ordered pairs on the coordinate plane. Several tasks explicitly ask students to plot given coordinate pairs (for example, (1,2),(2,4),(3,6) and (0,0),(3,-6)) and to extend a line on a graph to identify the y-intercept. Worksheets include items to identify slope from a graphed line and to write the equation of a line after plotting points.
Final Project
Planes, Trains, and Automobiles
Students fill tables of time (hours) and distance (miles) and use those pairs to plot distance vs. time on labeled axes. They are asked to graph all three travel methods on the same coordinate plane (x-axis = time, y-axis = distance) and to plot lines from equations such as y = 60x, y = 80x, and y = 400x. Students compute and plot specific coordinate pairs (for example, points from the table and rise/run such as 480/6 = 80) and handle fractional times like 1.25 hours when solving 500 = 400x.

Unit 4: Probability
Lesson 1
What Is Probability?
Students draw and label a Probability Line with 0, 0.5, and 1 and place event cards into regions (Impossible, Unlikely, Equal Chance, Likely, Certain). Students convert outcomes from experiments and spinners into fractions, decimals, and percents (e.g., 6/10 → 0.6 → 60%) and relate those values to positions on the probability line. The Student Activity Pages include a vertical Probability Line and tasks that require placing probabilities (rational numbers between 0 and 1) into appropriate locations.
Lesson 3
Probability Models
The cumulative quiz includes a "Probability Number Line" item that asks students to identify a number on a probability line for an equal-likelihood event, which requires locating 0.5. Throughout activities (e.g., dice, coin, spinner examples) students compute probabilities as fractions and convert them to decimals and percentages (for example, 1/2 = 0.5, 3/12 = 0.25, 3/6 = 1/2 ≈ 0.5). Several images and worked examples show fraction simplification and conversion to decimal/percent form, indicating students work with rational numbers in contexts that could be represented on a number line.
Lesson 6
Unit 4 Test
Students are asked to label 0, 0.5, and 1 on a probability line, name each probability, and give example events (Unit Review and Unit Test Question 1). The answer key explicitly interprets 0, 0.5, and 1 (e.g., impossible, equal chance, certain), reinforcing placement and meaning on a horizontal probability line. Multiple review/test items require students to reason about probabilities as fractions or decimals between 0 and 1, which involves understanding positions on a 0–1 number line.
Final Project
Happy Tails Dog Shelter
Students label a horizontal probability line with 0, 0.5, and 1 and place seven events along that line according to likelihood, directly practicing locating probabilities between 0 and 1. Students compute probabilities as fractions and percentages (for example, 3/60 = 5% and 9/60 = 15%) when building the probability model, providing numeric rational values to reason about placement. Students use those computed rational probabilities to justify where events belong on the number line during the discussion with a parent/adult.

Unit 5: Functions
Lesson 1
What Is a Function?
Students are asked to plot ordered pairs (x, y) on coordinate grids in multiple activities (Activity 3, Graphing Functions, and matching exercises) using axes labeled with integer scales (e.g., −5 to 5, −12 to 12). Students complete tables of x and y values, convert rules into outputs, and then place those pairs as points such as (−2, −3) and (2, 5) on the Cartesian plane. Several tasks require connecting plotted points to visualize linear and non-linear shapes, reinforcing placement of coordinate pairs.
Lesson 2
Linear and Nonlinear
Students are given tables of x-values and asked to compute corresponding y-values, then plot those ordered pairs on blank coordinate planes (e.g., sections with y = x - 4, y = 2x + 3, y = x + 2, y = x^2). Images and answer keys show points with integer coordinates (for example (−1, −1), (1, 1), (2, 3), (3, 5), (4, 7) and (1,1),(2,4),(3,9),(4,16)), and directions explicitly tell students to choose x-values, calculate y, plot the points, and decide if the graph is linear or nonlinear. Several student pages include coordinate planes with labeled axes and tick marks where students place the computed points.
Lesson 3
Understanding Functions
Students are instructed to label the x- and y-axes and to plot points for real-life scenarios (e.g., "Start at (0, 0)... For the first 3 hours, mark where she is each hour" for the sloth). Multiple activities (sloth, Timmy the Turtle, Bella's Balloon) require students to compute positions over time and place ordered pairs on the graph, then connect the dots. The student pages show axes with numeric scales and ask students to plot and interpret the resulting coordinate graphs.
Lesson 4
Intercepts
Students locate x- and y-intercepts on coordinate grids with labeled tick marks (e.g., identifying (4, 0) and (0, -3)) and record them as ordered pairs. Students read tables to find rows where x = 0 or y = 0 and write intercepts as points (0, y) and (x, 0). Students set x = 0 or y = 0 in equations and solve for the other variable, producing integer and rational intercepts (examples given: (4/3, 0), (−3/2, 0)) and record those as coordinate pairs. Mixed-review and word-problem activities provide grids for students to plot and interpret intercepts in context.
Lesson 5
Slope
Students are repeatedly asked to plot given coordinate pairs on graphs (e.g., activities asking students to plot (0,0), (2,1), (4,2), (−3,−1), etc.) and to choose two points from graphs or tables to compute slope using (y2−y1)/(x2−x1). Several activity pages show coordinate grids extending into negative values and include problems where students write Rise, Run, and Slope for plotted points. Students also convert equations to y = mx + b and identify y-intercepts as points on the vertical axis.
Lesson 6
Slope-Intercept Form
Students identify and plot points on a coordinate plane repeatedly (e.g., Graph 1–7, Graph 5–7, and many worksheet exercises ask students to identify two points and write the equation). Students locate and plot the y-intercept by finding the point where x = 0 (multiple activities instruct students to "plot the y-intercept (0,b)"). Students use tables of (x,y) values to choose two points, compute slope (including fractional slopes like 1/2 or -2/3), and then plot those pairs to draw lines.
Lesson 7
Creating Functions
Students work with graphs that show plotted points and coordinates (e.g., Case File 003 lists points (0, 5), (1, 8), (2, 11)) and are instructed to pick two clear points from a graph to calculate slope and y-intercept. Several Student Activity Pages direct students to "choose two points" from Graph 1, Graph 2, and Graph 3 and then find slope and write a function, and tables provide ordered pairs (e.g., Table 3 with (0,0), (2,14), (4,24), (6,32)).
Lesson 8
Comparing Functions
Students use coordinate pairs and points from graphs (for example (0, 0) and (30, 2)) to compute slopes. Students read values from graphs and tables (time vs. distance, money vs. weeks) and identify starting values by evaluating y when x = 0. Multiple activity problems require reading y-values at given x and comparing positions/rates from plotted lines on axes.
Lesson 9
Unit 5 Test
Students are asked to plot and read points on coordinate grids (e.g., graph the equation y = 3x - 1; images show points labeled (1, -1), (2, 2), (3, 5)). Students find x- and y-intercepts from equations (e.g., 3x + 2y = 12, y = 4x - 2) and determine intercept coordinates such as (4, 0) and (0, 6). Several problems require students to graph lines on a coordinate plane and use plotted integer points to compute slope and interpret line behavior.
Unit 6: Geometry
Lesson 2
Translations
Students plot and translate points with integer coordinates (e.g., P(2,1), Q(4,-2), M, A, B, X, Y, Z) on coordinate grids in multiple problems. Students translate line segments and polygons by computing new integer-coordinate images (e.g., A(1,4) → A'(3,0); X(0,0) → X'(-4,1)) and label the results on coordinate planes. Students use and apply the algebraic rule (x, y) → (x + a, y + b) in notes, worked examples, and Algebraic Translations problems to find and position pairs of integer coordinates.
Lesson 3
Reflections
Students plot and label many integer-coordinate points and vertices on Cartesian grids (e.g., A(4, -2), B(-3, 5), polygons with integer vertices) and record their coordinates before and after transformations. Students place and connect pairs of integer coordinates to form segments and shapes on coordinate planes (multiple activity pages require plotting shapes with vertices like (1,1), (3,1), (2,4) and reflecting them). Students use coordinate rules and formulas (for x-axis, y-axis, y=x, y=-x) to compute and position reflected coordinate pairs directly.
Lesson 4
Rotations
The lesson repeatedly asks students to plot and label integer-coordinate points and their rotated images on coordinate grids (e.g., M(6, -2) → M'(2, 6); D(2, -4), E(-5, 3), F(-2, -6); G(1, -3), H(4, -3), etc.). Multiple student activity pages provide labeled Cartesian grids and direct tasks to write new ordered pairs, plot original and image points, and identify rotation rules in coordinate notation. The algebraic rotations notes give explicit coordinate rules ((x,y)→(−y,x), (y,−x), (−x,−y)) that students use to calculate new integer pairs and then position those pairs on the plane.
Lesson 5
Sequences of Rigid Transformations
Students are given figures with integer coordinates (for example A(1,1), B(1,4), C(4,4), etc.) and instructed to draw the starting figure on a grid, perform specified translations (rules like T_{1,-1}, T_{-2,1}), reflections over the x- or y-axis, and rotations about the origin. Activity pages require students to plot and label vertices (using primes) after each move and to use blank coordinate grids for problems and challenges. The answer key and worked examples show how x- and y-coordinates change under reflections, translations, and rotations, with students determining new ordered pairs for image points.
Lesson 6
Dilations
Students calculate and plot new coordinate pairs after multiplying original (x,y) values by a scale factor (e.g., A(1,2) → A'(2,4); X(6,4) → X'(3,2)). Multiple activity pages ask students to graph triangles, rectangles, and polygons and then plot their dilated images on a coordinate plane (e.g., graph N(1,2), O(1,7), P(4,2) and plot A'B'C' after dilation). Tasks include dilations with non-integer scale factors (0.5, 0.25, 0.33, 2.5) and answer keys provide resulting decimal coordinates (e.g., P′(5,2.5)), which require plotting rational/decimal coordinate pairs.
Lesson 7
Sequences of Transformations
Students are given ordered pairs for vertices (e.g., A(1,2), B(2,2), C(1,4) and many others) and instructed to graph the original shapes on coordinate grids. Students compute new coordinates after transformations (examples show multiplying coordinates for dilations, adding for translations, and applying rotation rules) and then plot the resulting points. The Student Activity Pages repeatedly ask students to perform and plot rotations, reflections, translations, and dilations on coordinate planes, and the answer key lists transformed coordinates including non-integer values (e.g., 1.5, -4.5, 0.75).
Lesson 8
Triangles and Transversals
Students are asked to work with coordinate grids in multiple quiz and problem items (e.g., problems 12 and 13 and several transformation questions) where they must find final coordinates after dilations, reflections, and translations. The lesson includes tasks that require reading plotted points and giving their ordered pairs (for example: reflect (2,2) across the y-axis → (−2,2) then translate up 2 → (−2,4); find D'' after dilation and reflection). Answer keys show students computing and reporting coordinate pairs, indicating practice positioning pairs of integers on a coordinate plane.
Lesson 9
Using the Pythagorean Theorem
Students are given multiple coordinate examples (e.g., A(0,0) and B(6,8); A(–1,2) and B(2,–2)) and asked to draw horizontal and vertical segments from points to form right triangles. The Grid Problems activity lists many integer coordinate pairs (e.g., (-3,-4) and (0,0); (-6,8) and (3,20)) and provides graph grids where students plot the points and record distances. Instructions explicitly tell students to count squares and use the grid to create legs of right triangles, which requires positioning points on the coordinate plane.
Lesson 11
Unit 6 Test
Students are given many coordinate-plane tasks that require locating and plotting points and figures (e.g., reflect triangle across y = x; reflect across the y-axis; rotate triangles 90°; translate using T5,−3). Several problems list explicit integer coordinates for vertices (for example A(2,3), B(4,8), C(6,4); X(0,1), Y(2,1), Z(1,3); M(1,0), N(3,0), O(2,−2)) and provide grids labeled with integer axes for students to plot and transform. Answer keys show students produce new ordered pairs after transformations, indicating practice in finding and positioning pairs of integers on the coordinate plane.
Final Project
Abstract Art Gallery
Students are instructed to draw both an x-axis and y-axis on graph paper and to draw shapes onto that coordinate grid. They reflect a polygon across the x- or y-axis, rotate a polygon 90° clockwise about the origin, and translate a polygon using rules like "move right 4 units and up 2 units," all of which require plotting and positioning coordinate pairs. Students also dilate a figure about the origin by a factor of 3 and transfer both original and dilated figures to tracing paper, practicing scaling and placing points in the coordinate plane.
Unit 7: Linear Equations
Lesson 5
Intersection and Graphing
Students repeatedly plot lines and identify intersection points on coordinate grids (e.g., labeling solutions such as (2, 3), (1, 3), (0.5, 3), (1.5, 2.5), and (2.67, -0.33)). Multiple activities ask students to graph pairs of linear equations, write the coordinate pair of the solution when lines intersect, and convert equations to slope-intercept form to compare slopes and intercepts. The Scratch activity and several student pages use an x-y grid and require students to position sprites or points by coordinates, reinforcing placing ordered pairs on a coordinate plane.
Lesson 6
Substitution and Elimination
Students are asked to graph pairs of linear equations on labeled coordinate grids (examples range from -7 to 7 and -12 to 12) and to estimate and record the intersection point (e.g., the image labels the intersection (3, 1)). Multiple activity pages require students to plot equations, rewrite in slope-intercept form, and compare graphing results with algebraic solutions. The Desmos section and tasks with fractional and decimal coefficients (e.g., y = 1/2 x + 1, decimals like 0.5x + 2) ask students to locate intersection points with rational or decimal coordinates.
Lesson 7
The Point of It All
Students repeatedly plot points and draw lines on Cartesian coordinate grids (e.g., tasks giving pairs like (0,2) and (2,6); (6,6) and (6,0)) and use those plotted points to determine intersections. Several pages provide blank coordinate grids for students to graph lines and estimate intersection points (examples include estimating (2.5, 5.5) and graph images with axes from -16 to 16). Students find exact intersection coordinates algebraically and interpret fractional/decimal solutions (answer key includes (4/3, 4/3) ≈ (1.33, 1.33) and examples with (2,4), (1,4), etc.).
Lesson 8
Linear Algebra In the Wild
Students solve systems of equations and record solutions as ordered pairs (for example, Sophie and Jake as (30, 35); candy prices as (4, 3.85); break-even solutions as (5, 150) and (5, 25)). The lesson repeatedly tells students they can "create a graph of both lines to see a picture of the solution" and refers to seeing the solution in the graph. Student activity pages provide space for conclusions written as coordinate pairs and include prompts and grids that support graphing the relationships.
Lesson 9
Unit 7 Test
Students are asked to plot points and graph lines on coordinate grids in multiple problems (e.g., plotting (2,3) and (4,7), graphing y = 2x - 1, and graphing systems such as y = -x + 4 and y = x - 2). Several tasks require finding intersection points and writing solutions as ordered pairs (e.g., (3, 1), (1, 4), and fractional/decimal intersections like (3.5, 1.5)). Image captions and answer keys show students locating and interpreting integer and rational coordinate pairs on the coordinate plane for systems and single-line graphs.
Final Project
Getting Ready for College
Students set up and graph linear equations on labeled axes (e.g., Months vs. Total Cost, Miles vs. Cost, Hours vs. Cost) and are instructed to plot both lines and clearly mark the break-even intersection. Several activities require completing tables of values (ordered pairs) and then plotting those points (e.g., phone plan table x = 0,1,2,3,4; housing and entertainment graphs) to produce the lines. The tasks explicitly ask students to plot points, label axes, and identify intersection points on the coordinate-style grids provided.

Unit 8: Data
Lesson 1
Statistics Review
Students are instructed to draw box plots on a number line and to put dots above the minimum, maximum, median, Q1, and Q3 (e.g., "Draw your box plot on a graph or number line," and step-by-step box-plot examples). Multiple activities require sorting values and marking those specific numerical positions on a horizontal number line (Push-Up Challenge, Box It Up, Box Plot Builders). The Parent Plan also lists "Display numerical data in plots on a number line, including dot plots, histograms, and box plots," which students practice in Variability Practice.
Lesson 3
Constructing a Scatter Plot
Multiple student activity pages require students to set up horizontal and vertical axes with numeric ranges and scales (e.g., x-axis 0.0–4.5 for Study Hours, y-axis 0–70 for Practice Problems) and then plot ordered pairs from data tables. Directions repeatedly tell students to label the x‑axis and y‑axis, choose an appropriate scale, and plot points (Steps 1–4), and several activities (Weather Watch, Organizing Data, Constructing Scatterplots) ask students to plot decimals and integers such as 0.5, 1.5, and whole numbers as (x,y) pairs. Tasks also ask students to make predictions by reading positions on the axes, which requires locating rational values on the horizontal and vertical number lines of the coordinate grid.
Lesson 4
Linear Models
Students read and interpret scatterplots with labeled axes and plotted points when they choose equations that match best‑fit lines (Activity 1: multiple scatterplots with axes and trend lines). Students pick two points on a line (for example (0,5) and (1,6)) to compute slope and write equations in y = mx + b form. In the Bird Migration activity, students are instructed to record data, plot each day's point on a grid (x = day, y = number of birds), and draw a best‑fit line, which requires positioning ordered pairs on a coordinate grid.
Lesson 6
Unit 8 Test
Students are asked to draw scatterplots from given pairs of numbers (e.g., Hours of Video Games vs. Homework Completed, Hours of Sleep vs. Mood Rating, Hours of Social Media vs. Number of Texts) and to label axes and title the graphs. Several items require students to identify coordinates of outliers and read specific point coordinates (the answer key lists outliers like (3, 9) and (11, 3)), showing practice in locating ordered pairs on a coordinate grid. Multiple tasks also present data tables of paired numerical values (including decimals like 2.5, 3.5) for students to plot and analyze relationships.
Final Project
Collecting and Organizing Data
Students are instructed to label horizontal and vertical axes, choose an appropriate, evenly spaced scale, and plot each pair of values on a scatterplot (e.g., "Plot each pair of values" and example axes with numeric scales). The scatterplot activity asks students to draw the graph, space numbers evenly, and plot dots or X's for each data pair, and shows example x- and y-axis scales (Jumping Jacks 20–65, BPM 70–160). The Part 4 and scatterplot student pages guide students through setting up axes and positioning data pairs on a two-dimensional coordinate grid.

Unit 9: Semester Exams
Lesson 1
Numbers Review
Students compute and state final positions relative to zero in Activity 1 (e.g., hiker: 9 + (−9) = 0 feet; submarine: −12 + 7 = −5, described as 5 meters below sea level), showing they reason about location on a vertical scale. In Activity 4 Part 4 students approximate irrational square roots by identifying the two consecutive integers between which each root lies (e.g., √15 between 3 and 4) and judge which integer it is closer to, which is an implicit placement on a number line. Several problems ask students to interpret positive and negative changes (temperature drop, account balance, game points), reinforcing understanding of position relative to zero.
Lesson 2
Proportions Review
Students are asked to graph equations on a coordinate grid (e.g., "Graph the equation y = 6x"), label at least three points, and circle the origin. Tasks ask students to interpret specific points (for example, explain what (0, 0) and (1, 6) represent) and to create and graph their own proportional relationships by writing an equation, making a table, and plotting points. The materials include a numbered coordinate grid (axes labeled from -14 to 14) and a pictured diagonal line with highlighted points, supporting practice in placing pairs of numbers on the plane.
Lesson 3
Expressions Review
Students plot and graph integer coordinate pairs on coordinate grids (for example points (0,0), (1,14), (2,28), (3,42) and (0,0), (1,75), (2,150), (3,225)) and are asked to graph equations such as y = 14x, y = 75x, y = 18x, and y = 12x + 20 on blank axes. Students find slope from two given points (e.g., (3,1) and (4,9)) and write equations in the form y = mx + b after identifying y-intercepts, which requires locating points on horizontal and vertical axes. Multiple activities require students to graph lines and compare their steepness, which involves positioning pairs of integer coordinates on the coordinate plane.
Lesson 4
Probability Review
Students are asked to label 0, 0.25, and 1 on a probability line, which requires placing rational numbers on a horizontal number line. Several tasks require expressing probabilities as fractions and decimals (e.g., 7/25 = 0.28, 21/26), reinforcing students' work with rational numbers that could be located on a line. Compound-event answers use ordered pairs to list outcomes (e.g., (H,1) through (T,6)), showing practice with pairs of values in outcome notation.
Lesson 5
Semester Exam
Students are asked to label a probability line with 0, 0.25, and 1, which requires placing rational numbers (decimals) on a horizontal number line. Multiple problems ask students to plot points and graph lines on a coordinate grid (e.g., graph y = 4x; graph the line through (0, 0) and (4, −8); plot lines using given integer pairs such as (1,2), (2,0), (3,−6) and (1,0), (2,3), (3,12)). The included coordinate grid image shows axes from −10 to 10, indicating students will work with a standard horizontal/vertical coordinate plane to position points and lines.
Lesson 6
Functions Review
Students are asked to graph equations on a coordinate grid (for example, graph y = 3x − 2) and to work with specific ordered pairs such as (2, 1), (6, 9), (−1, −3), (1, 1), and (3, 5). Several tasks require identifying x- and y-intercepts on a Cartesian graph whose axes are marked with positive and negative integers. Students also find slopes from two given integer-coordinate points and use tables of integer x- and y-values to identify intercepts (for example, the table with x = 3, 4, −5 and y = 2, 0, −2).
Lesson 7
Geometry Review
Students plot and transform points with integer coordinates on coordinate grids in multiple tasks (e.g., draw Triangle L(2,1), M(4,1), N(3,3) and dilate by a factor of 3; find L′(6,3), M′(12,3), N′(9,9)). Students compute new coordinates after reflections, translations, and rotations (e.g., reflect A(-3,4) across the y-axis, reflect D(1,-2) across y = x, translate A(1,-3), B(2,5), C(4,1) by (x+3,y-2), and rotate P(1,-9) 90° CCW). Students also find distances between points given by coordinates (e.g., distance between A(0,0) and B(6,8)).
Lesson 8
Linear Equations Review
Students graph lines and points on coordinate grids in Activity 2 (Part B) where they graph y = x - 3 and y = -2x + 1 and compute slopes from given point pairs (e.g., (3,2) and (7,10)). Activity 3 provides coordinate-grid graphs of pairs of lines and asks students to identify intersection points and record solutions such as (2,3) and (2,0). Several problems require plotting and reading ordered pairs and using the coordinate plane to solve systems by graphing, substitution, and elimination.
Lesson 9
Data Review
Activity 2 asks students to draw a box plot using ordered data and a horizontal number line (the answer key lists min, Q1, median, Q3, and max and describes drawing a box from 8 to 18 with whiskers to 6 and 20). The box-plot image shows a horizontal number line from 5 to 22, which requires students to place those five summary values on that line. Activity 3 has students analyze provided scatterplots and identify types of correlation, which requires reading positions of paired values on a coordinate-style graph.
Lesson 10
Semester Exam
Students are asked to graph equations and lines (e.g., Graph y = 2x − 4 and the line shown through (1, −5), (2, −3), (3, −1), (4, 1)), and to solve a system by graphing (y = x + 2 and y = −x + 6) with the intersection labeled (2, 4). Students perform coordinate transformations and work with ordered pairs: translate a square using T_{1,−3}, reflect A(5, 10) across the y-axis to A′(−5, 10), rotate B(−3, 4) 90° clockwise to B′(4, 3), and translate triangle ABC given by integer coordinates. Students also find intercepts as coordinate points (e.g., y-intercept (0, 4) and x-intercept (4, 0)).