


Sixth Grade - MATH
5: Math
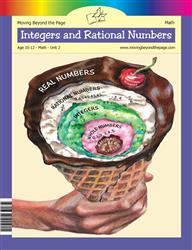
Unit 2: Integers and Rational Numbers
Lesson 4
Negative Numbers and Integers
Students work with horizontal and vertical number lines (images and activities showing numbers from -5 to 5 and -300 to 300) and create a foldable where they mark and plot numbers such as -4 and +4 on a number line. The Parent Plan skills list explicitly states: "Extend number line diagrams and coordinate axes familiar from previous grades to represent points on the line and in the plane with negative number coordinates." Students also solve many real-world problems that require expressing quantities as negative or positive integers (temperatures, depths, debt).
Lesson 6
The Coordinate Plane
Students plot and label points with positive and negative coordinates in all four quadrants through the foldable, Day 2 plotting tasks, and multiple Student Activity Pages that list and require plotting points such as (-5,3), (6,-5), and (-4,-4). Students solve real-world mapping tasks (Deon's downtown map and Explorer Eddie) by tracing routes from the origin and recording locations on a grid. Students investigate opposites on number lines and note that opposite numbers are the same distance from zero, and they use reflection activities to find points across the x- and y-axes.
Lesson 7
Coordinate Problem Solving
Students plot and work with points that have positive and negative coordinates across all four quadrants (for example, the Coordinate Pictures activity requires students to plot 10–14 points using all four quadrants, and many practice grids include points like (7, −3), (−3, 5), and (−4, −1)). Students calculate horizontal and vertical distances between points that share the same first or same second coordinate in multiple exercises (for example, horizontal distance problems like (7, −3) vs. (2, −3) and vertical distance problems like (−3, 5) vs. (−3, −4), plus bus-stop and city-map problems where students add horizontal and vertical legs to find total miles/blocks). Students are asked to reason that distances are always positive and the materials state that distance is the absolute value of a difference, and the answer keys show positive distances for same-coordinate pairs.
Lesson 8
Unit 2 Test
Students are asked to plot points and identify which quadrant points lie in (e.g., problems listing (2, -2), (-4, 7), (-3, -8), (3, 8) and other quadrant-identification items). Students perform translations, reflections, and moves on coordinate grids (e.g., plot (2,7) then move left/right/up/down, reflect over axes, and translate points in Exercises 18–21). Students are asked to state horizontal and vertical distances between pairs of points (e.g., "state the horizontal and vertical distances between (-5, 2) and (4, -3)" and a similar task with (4, -6) and (-2, 1)), and students create rectangles and sequences of points that produce shared x- or y-coordinates (e.g., points (1,7), (1,0), (-3,0), (-3,7)).
Final Project
Coordinate Game
Students are instructed to use a coordinate grid that includes all four quadrants (x and y axes labeled from -12 to 12) and to place and sketch playing pieces in specified quadrants. Students call out pairs of x-y coordinates to target locations in an opponent's quadrant and mark those coordinates as hits or misses on their opponent sheet. The checklist and game sheets require students to record which quadrants they and their opponent use and to plot integer coordinate points for targets that occupy specified numbers of coordinate points.
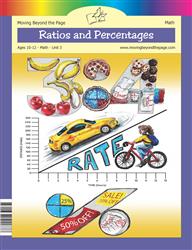
Unit 3: Ratios and Percentages
Lesson 3
Equivalent Ratios
Students make and use tables of number pairs and plot those pairs on a coordinate plane (e.g., Activity 3: points (1,6), (3,18), (5,30) and the point (4,24); Kara's key chains points such as (5,2), (15,6), (30,12)). Students are instructed to graph values from tables and draw a line through plotted points (Day 2 and Day 3 problems). A Basic Skills Review item asks students to identify the quadrant of the point (-5, 3), showing some engagement with quadrant location.
Lesson 8
Unit 3 Test
Students complete tables and plot coordinate pairs on labeled coordinate grids (e.g., the Apple Pies activity asks students to plot points (10, 3), (20, 6), and (40, 12) on a grid with Apples on the x-axis and Pies on the y-axis). Students complete other tasks that require making tables of equivalent ratios and plotting those pairs (Tomás's models and hours table and graph). Several problems ask students to read and use coordinates to answer questions about quantities (e.g., how many apples for 24 pies, how many pies from 30 apples).
Unit 4: Algebraic Expressions
Lesson 7
Unit 4 Test
The lesson's Skills list explicitly states: "Show that the distance between two rational numbers on the number line is the absolute value of their difference, and apply this principle in real-world contexts." Students complete problems involving absolute value and integer distances (e.g., solving -14 - (-9) and changing subtraction to adding the opposite).
Unit 5: Algebraic Equations
Lesson 2
Solving One-Step Equations, Part 1
Students are asked to plot the point (3, -4) on a coordinate grid and identify its quadrant in the Basic Skills Review. An image asks students to plot the point (-3, 4) and identify it as being in Quadrant II. The review includes a small coordinate grid for students to use when plotting points.
Lesson 7
Independent and Dependent Variables
Students create tables of (x,y) solution pairs and plot those ordered pairs on Cartesian grids that show all four quadrants (examples show axes from -6 to 6 and -10 to 10). Students practice making input/output tables, plotting points from those tables (e.g., y = x + 2, y = 2 - x, 2x - 1 = y), and answering questions that ask them to identify solutions in specific quadrants (e.g., name a solution in Quadrant II or Quadrant IV). Several student activities require rewriting equations so y is isolated and then producing and graphing multiple solution pairs on the coordinate plane.
Lesson 8
Unit 5 Test
Students create tables of ordered pairs and graph solution sets on coordinate grids (for example, x - y = 8 with points (0, -8), (4, -4), (8, 0) and y = 2x + 1 with points (-1, -1), (0, 1), (1, 3)). Students are asked to rewrite equations, make tables, plot lines on coordinate grids, and name points that are or are not solutions. Several activities include coordinate grids and plotted lines and the provided tables/graphs include negative values for x and/or y.
Unit 6: 2D Geometry
Lesson 3
Triangles
Students are asked to place points and draw triangles using given coordinates in all four quadrants (e.g., construct a right triangle from (1,1) in Quadrant I, a triangle starting at (-1,-1) in Quadrant III, and triangles using points like (-2,2) to (-7,2) and (1,-2) to (7,-2)). The student activity pages require plotting line segments between specific coordinate pairs (for example, (-3,-5) to (-6,-5) and (4,2) to (8,2)) and drawing triangles on a laminated coordinate grid. The directions have students create horizontal and vertical segments of specified unit lengths on the grid (e.g., draw a side of length 5 units to the right from (1,1) and a vertical side of length 4 units up from (1,1)).
Lesson 6
Scale Drawings
Students draw and label shapes on a coordinate grid (Activity 2), including a pictured example that gives corner coordinates for rectangles (for example, bottom left at (3,4) and top right at (7,6)). The Basic Skills Review asks students to determine coordinates after reflections across the x- and y-axes, producing answers that include negative coordinates (for example, (−3,−2) and (3,2)). Several activities require placing and measuring shapes on a plotted grid and counting squares to find lengths and heights.
Unit 7: 3D Geometry
Lesson 2
Surface Area
The Basic Skills Review #13 (Problem 5) asks students to graph the points (3, 2), (-3, 2), (-5, -1), and (1, -1) on a coordinate plane and then connect the points to name the resulting polygon. The answer-key image and description also show a coordinate-plane diagram of a parallelogram with labeled vertices, indicating students practice plotting points and interpreting placed points on all four quadrants.
Lesson 5
Problem Solving With Solids
The Basic Skills Review includes a coordinate-geometry question (Problem 8) in which students are given a point A(3, 2) and asked to find the coordinates of its reflection over the y-axis. The answer key explicitly shows the coordinate result (-3, 2), so students practice reading and manipulating ordered pairs on a coordinate plane. The review also contains a graph with a marked point, indicating at least one direct use of coordinates.

Unit 8: Statistics
Lesson 8
Making Inferences
The Basic Skills Review includes a coordinate-grid problem where students are given Point A at (3, -2) and Point B at (-4, 2) and asked to find the horizontal and vertical distances between A and B. The answer key states the horizontal distance is 7 units and the vertical distance is 4 units, showing students work with coordinates that include negative values. Students use coordinate pairs to determine distances along axes.
Unit 9: Skills Review
Lesson 2
Fractions, Ratios, and Coordinates
Students play an online graphing game with a 4 Quadrants option and plot given points on coordinate grids (e.g., plot (-2, 4), (3, 5), and (-3, -2)). Students reflect points over axes and record the new coordinates (reflect (-2, 4) to (2, 4) and to (-2, -4)), showing practice across multiple quadrants. Students calculate horizontal and vertical distances between plotted points (questions ask for horizontal/vertical distance and the distance moved when traveling between points).
3: Math

Unit 3: Expressions
Lesson 4
Graphing Proportions
Students create tables of (x,y) values and plot those points to make graphs (e.g., y = 3x, y = 2x, y = 1/2x) and are instructed to plot and connect points on coordinate grids. Several activities include negative values and negative-slope equations (e.g., y = -3x + 2 example with points producing negative y, Graph 4 with point (6, -18), and the "Walk the Graph" activity with negative-slope equations). Students convert graphs to equations by selecting non-origin points and computing k = y/x, which requires reading and using coordinates.
Lesson 6
Intercepts
Students identify and plot x- and y-intercepts as ordered pairs (examples given: (3,0), (0,-2), (-4,0), (0,5)) on coordinate grids that include negative and positive axes. Students set y = 0 or x = 0 to find intercepts algebraically for equations such as 2x + 4y = 8, 3x - 6y = 12, and then plot those points and draw the corresponding lines. Activities require plotting lines using intercepts with negative and positive values (e.g., Line G: x-intercept (-5,0), y-intercept (0,5)), so students practice placing points across different quadrants and graphing lines through them.
Lesson 7
Rise Over Run
Students plot and use coordinate pairs to draw right triangles and count rise and run on coordinate grids (examples include points like (2,3) and (6,7) and problems with coordinates such as (-4,1) & (2,4), (-5,-1) & (3,5), and (-3,-4) & (3,2)). Students draw vertical and horizontal segments between points, count how many squares they move, and record the change in x (run) and change in y (rise) including direction signs. Students set up ratios from those rise/run values and compare slopes, which uses coordinates to compute vertical and horizontal differences between points.
Lesson 8
y = mx + b
Students plot lines and points on coordinate grids labeled from -10 to 10 throughout the lesson (e.g., Activity 5 uses points (−2, 5) and (4, −1); many student pages show axes from −10 to 10). Students graph equations that extend across positive and negative x and y values (examples include y = 2x + 1, x = 3, and lines with negative slopes) and convert and plot points from tables and pairs of coordinates. Activities require finding slope from two points and plotting additional points, so students practice placing and extending points in multiple quadrants.

Unit 5: Functions
Lesson 1
What Is a Function?
Students plot ordered pairs that include negative and positive x- and y-values (for example, using x = -2, -1, 0, 1, 2 to produce coordinates like (-2, -3), (0, 1), (2, 5)). Students complete tables of values and then graph those points on coordinate grids that range from negative to positive values (axes shown from -10 to 10 or -12 to 12 in multiple activities). Students match tables of values to graphs and plot points for both linear and non-linear rules, connecting points across quadrants to see the shape of functions.
Lesson 2
Linear and Nonlinear
Students compute y-values from given x-values, fill tables, and plot those points on blank coordinate planes for equations such as y = 2x + 4, y = x - 4, and y = x^2. Students examine graphs and tables to decide whether relationships are linear or nonlinear and calculate rate of change using differences in y-values. Several provided graphs and images show axes that include negative values (e.g., ranges from -5 to 5 and -7 to 7), so students work with points that can lie in different quadrants when completing the graphing tasks.
Lesson 3
Understanding Functions
Students read real-world scenarios (Sylvia the Sloth, Timmy the Turtle, Bella's Balloon) and plot points on labeled coordinate axes, starting at (0,0) and marking positions at specified times. Students label axes, mark and connect dots to show motion, and match or sketch graphs that represent increases, decreases, and flat intervals. Students also match given graphs to verbal descriptions and interpret shapes to tell real-world stories.
Lesson 4
Intercepts
Students locate and record x- and y-intercepts on coordinate graphs with axes labeled from -5 to 5, including examples with negative coordinates (e.g., x-intercept (4,0), y-intercept (0,-3)). Students find intercepts from tables by identifying rows where x = 0 or y = 0 and solve for intercepts from equations by substituting 0 for one variable and solving for the other. Students apply intercepts to real-world contexts (movie tickets, walking/water, basketball) and write intercept coordinates to interpret starting values and endpoints.
Lesson 5
Slope
Students plot and connect ordered pairs on coordinate grids in multiple activities (examples include points with negative coordinates such as (-3, -1), (-2, 5), and (3, -2)) and complete exercises that require reading and marking axes that extend into negative values. Students use coordinates from tables (each row treated as a point) and apply the slope formula m = (y2 − y1) / (x2 − x1) to compute changes in y and x between two plotted points. Several tasks ask students to count and record 'Rise' and 'Run' between plotted points and to choose two rows from a table to compute slope, demonstrating direct practice with coordinates and differences.
Lesson 6
Slope-Intercept Form
Students plot and identify points on Cartesian grids and use coordinates from graphs and tables to write equations in slope-intercept form (many activities show grids ranging from -7 to 7 and ask students to identify points and y-intercepts). Students compute slopes by subtracting y-values and x-values (m = (y2 - y1)/(x2 - x1)) for pairs of points, including examples with negative coordinates and points in different quadrants. Several activities ask students to graph equations from y = mx + b and to plot lines that extend through multiple quadrants, and the quiz includes pairs like (3,2) and (3,-1) that require understanding vertical/horizontal relationships.
Lesson 7
Creating Functions
Students read and use coordinate pairs shown on graphs (for example, (0,5), (1,8), (2,11)) and name variables for the x- and y-values. Students apply the slope formula m = (y2 − y1)/(x2 − x1) to compute change between two plotted points and translate tables and graphs into linear function rules. Activities ask students to pick two clear points from a graph and calculate slope and y-intercept, so they practice working directly with coordinates and differences in coordinates.
Unit 6: Geometry
Lesson 2
Translations
Students plot and translate points and shapes on coordinate grids labeled from -6 to 6, working with points such as Q(4, -2), B(-2, -5), and others that require graphing in multiple quadrants. Students apply algebraic translation rules (x,y) → (x + a, y + b) to compute new coordinates (examples and activities show P(2,1) → P', M(6,-2) → M', and triangle translations). An optional real-world activity has students describe checker moves as translation rules and record start/end coordinates.
Lesson 3
Reflections
Students plot and reflect points with positive and negative coordinates on coordinate grids that range from -5 to 5 (examples include A(4, -2), B(-3, 5), and many vertices in different quadrants). Activities ask students to reflect points and shapes across the x- and y-axes and diagonal lines, and to label original and reflected coordinates using coordinate rules such as (x,y)→(x,−y) and (x,y)→(−x,y). Students measure perpendicular distances using graph-paper boxes (counting squares) to place reflected points the same distance from a line of reflection.
Lesson 4
Rotations
Students work with ordered pairs and plot points and shapes around the origin using algebraic rotation rules (e.g., A(3, 2) → A′(−2, 3); M(6, −2) → M′(2, 6)). Multiple activity pages require students to identify and perform 90°, 180°, and 270° rotations on coordinate grids that place points and images in different quadrants. The materials explicitly focus on using coordinates, the origin, and coordinate-rule calculations to locate rotated images and note that rotations preserve distance from the origin.
Lesson 5
Sequences of Rigid Transformations
Students plot and manipulate figures given with explicit coordinates on coordinate grids in multiple activities (e.g., squares and triangles with vertices like A(1,1), B(1,4), C(4,4), D(4,1); points with negative coordinates in lower-left and lower-right problems). Students perform translations, reflections, and rotations using coordinate rules (e.g., T_{1,-1}, rotate 90° about the origin, reflect over the x- or y-axis) and draw resulting images on grids in all four quadrants. Students are asked to label vertices, apply sequences of moves, and verify congruence by checking that side lengths and angles remain the same after transformations.
Lesson 6
Dilations
Students practice plotting and transforming points on the coordinate plane by multiplying x- and y-coordinates by a scale factor and then plotting the resulting dilated points. Several activities ask students to graph shapes on labeled coordinate grids (including grids that span negative and positive values) and to compute new side lengths after dilation by multiplying original lengths by the scale factor. Student tasks require using coordinates to create and compare original and image points and to identify whether a transformation is a dilation.
Lesson 7
Sequences of Transformations
Students plot and transform points with both positive and negative coordinates (for example Triangle A with A(-2,1), B(3,2), C(-2,4) and Rectangle N with N(-4,4), O(-4,-3), P(1,-3), Q(1,4)), performing rotations, reflections, translations, and dilations on coordinate grids. The activities require students to graph original figures and their images across the axes and to compute new coordinates by applying rules (e.g., multiplying coordinates for dilations, adding to coordinates for translations, and using the rotation rule (x,y) → (y,-x)). Multiple problems present points in all four quadrants and ask students to map and label resulting coordinates after sequences of transformations.
Lesson 8
Triangles and Transversals
Students work with coordinate grids on the unit quiz and practice pages where triangles and squares are plotted and transformed; several quiz problems ask students to reflect a point across the y-axis and translate it (e.g., (2,2) → (-2,4)) and to dilate then reflect a point (e.g., D(3,1) → (6,2) → (6,-2)). Students read and use coordinates from plotted figures (grids 12 and 13) to determine new vertex locations after transformations. The activities require students to record final coordinates after transformations, so they practice using ordered pairs and reading positions on the coordinate plane.
Lesson 9
Using the Pythagorean Theorem
Students plot and work with points that have negative and positive coordinates (for example A(0,0) and B(6,8); A(–1,2) and B(2,–2)) and are shown coordinate grids in the Grid Problems activity. Students are instructed to draw horizontal and vertical segments between two plotted points to form right triangles and then compute the diagonal distance by applying a² + b² = c². Multiple student activity pages list point pairs that lie in all four quadrants and provide space for students to plot and calculate distances.
Lesson 11
Unit 6 Test
Students plot and transform points with both positive and negative coordinates on coordinate grids (examples include points like (2, -4), (4, -1), (5, -3), (-2, 3), and (-4, 1)) and perform reflections across the x- and y-axes, reflections across y = x, rotations about the origin, and translations using rules such as T5,-3. The Parent Plan skills list explicitly states students should "Apply the Pythagorean Theorem to find the distance between two points in a coordinate system," and several answer keys show distance calculations using square roots of summed squares (e.g., √(36+64)=10, √(81+144)=15). Multiple problems require graphing and labeling triangle vertices and their images on grids that span negative and positive axes.
Unit 7: Linear Equations
Lesson 5
Intersection and Graphing
Students plot and graph linear equations on coordinate grids and identify intersection points as coordinate pairs (for example, students record solutions like (2, 3), (1, 3), (0.5, 3), and verify these points by substitution). Students graph lines in multiple activities, label the number of solutions (one, none, infinite), and write the coordinate pair when lines intersect. Students also convert equations to slope-intercept form and compare slopes and intercepts to determine intersection behavior without graphing.
Lesson 6
Substitution and Elimination
Students are asked to graph linear equations on coordinate grids (axes shown from negative to positive values) and to estimate intersection points by plotting the lines (e.g., graphing 3x - 2y = 7 and x + y = 4, graphs ranging -7 to 7 and -12 to 12). Activity pages require students to plot lines, rewrite in slope-intercept form, and identify the solution as an ordered pair; answer keys include solutions with negative coordinates (e.g., (−1, −5), (−3, 7), (3, 1)), indicating students work with points in different quadrants. Students also use graphing and algebraic methods (substitution/elimination) to find ordered pairs that lie on the coordinate plane.
Lesson 7
The Point of It All
Students are repeatedly asked to plot lines from two given points on coordinate grids (examples: plot Line A through (0,2) and (2,6), plot lines on grids ranging from -16 to 16 and -7 to 7). Activities require students to write equations from plotted points, graph lines, estimate intersection points, and determine whether lines intersect, are parallel, or coincide. The materials include worked examples and practice problems that have students graph lines and find exact intersections algebraically (using substitution and elimination).
Lesson 9
Unit 7 Test
Students are asked to graph lines and plot points on coordinate grids in multiple problems (e.g., slope through (2,3) and (4,7); graph y = 2x - 1; graph y = -x + 4 and y = x - 2 and record the intersection (3,1)). Several problems require solving systems by graphing and interpreting intersections or parallel lines (e.g., pairs like y = 3x + 1 and y = 3x - 5 labeled 'no solution'). Images and answer keys include points with negative coordinates (for example (0, -1), sample point (-1, 5), and intersection points with negative y), so students practice plotting and reading points with negative coordinates as part of graphing tasks.

Unit 8: Data
Lesson 6
Unit 8 Test
Students draw and label scatterplots from given data tables and blank grids (e.g., Hours of Sleep vs. Mood, Hours of Video Games vs. Homework, Hours of Social Media vs. Number of Texts). Students identify coordinates of specific points such as outliers (answer key lists coordinates like (400, 9), (3, 9), (11, 3), (1, 120), (8, 25)). Students analyze plotted data by describing trends, clusters, variability, and by matching scenarios to scatterplot patterns.
Final Project
Collecting and Organizing Data
Students are instructed to set up axes, choose scales, and plot each pair of numerical values on a scatterplot (e.g., jumping jacks vs. heart rate). The materials guide students to label axes, plot data points from their numerical data table, and analyze patterns such as positive or negative trends and outliers. Students also record paired measurements for each person in a numerical data table before plotting.

Unit 9: Semester Exams
Lesson 3
Expressions Review
Students plot points and graph linear relationships from tables and equations (e.g., Activity 2 plots (0,0),(1,14),(2,28) and Activity 2/4 ask students to graph y = 14x, y = 75x, y = 20x, y = 15x + 30). Students find slopes and y-intercepts from pairs of points and equations (e.g., Activity 3 asks for slope from (3,1) and (4,9), and a problem uses a line passing through (3, −4) and (0,5)). Students write equations in y = mx + b form and interpret slope as a unit rate in real-world contexts such as pay, rental cost, and delivery charges.
Lesson 6
Functions Review
Students are asked to graph linear equations on a coordinate grid (e.g., graph y = 3x - 2) and to read and identify points shown on a Cartesian plane whose axes are marked from -5 to 5. Several tasks require identifying x- and y-intercepts from graphs and tables (including finding an x-intercept from a table with negative and positive x-values). The provided graph image shows and labels points with negative and positive coordinates (for example, (-1, -3), (1, 1), (3, 5)), so students work with coordinates that include negative values.
Lesson 7
Geometry Review
Students plot and manipulate points on coordinate grids in multiple activities (e.g., Activity 1 requires graphing Triangle LMN with vertices L(2,1), M(4,1), N(3,3) and dilating by a factor of 3). Activity 2 has students work with points having negative x and/or y coordinates (e.g., A(-3,4), D(1,-2), F(3,-5), P(1,-9)) to perform reflections, translations, and rotations across the axes and about the origin. Activity 4 asks students to find the distance between A(0,0) and B(6,8) using the Pythagorean Theorem and to write the distance formula for two points.
Lesson 8
Linear Equations Review
Students calculate slopes from pairs of points (e.g., (3, 2) and (7, 10); (−2, 4) and (−8, −8)) and use coordinate pairs to find slope. Students graph linear equations on coordinate grids (e.g., y = x − 3 and y = −2x + 1) and interpret intersections when solving systems by graphing. Several activities provide coordinate grids and require plotting or using points to determine graph behavior.