


Seventh Grade - MATH
5: Math
Unit 7: 3D Geometry
Lesson 1
Three-Dimensional Solids
Students read that platonic solids are often used as dice and that because all faces are congruent each face has an equal chance of being rolled. Students also build and assemble nets into polyhedra (including cubes and tetrahedrons) in hands-on activities, exposing them to shapes that could serve as uniform sample spaces.
Unit 8: Statistics
Lesson 2
Populations and Samples
The lesson explicitly teaches that random sampling gives every member of the population an equal chance of being selected and illustrates this with the marble bag example and suggestions such as randomly choosing 100 names or every 100th citizen. Students practice identifying representative vs. biased or convenience samples in multiple activities (e.g., selecting from registration lists, avoiding neighborhoods closest to home). Several activity pages ask students to choose which sampling methods are random and which introduce bias, reinforcing the equal-chance idea.
Lesson 8
Making Inferences
Students are instructed to use random sampling (e.g., "Without looking, reach into the package and pull out 10 candies") to select items. They record counts, write part-to-whole ratios for each candy color, and convert those ratios to percentages (for example, 3:10 → 30%). Students compare sample percentages to population percentages by creating dot plots, frequency tables, and optional percent calculations for the whole bag.
3: Math
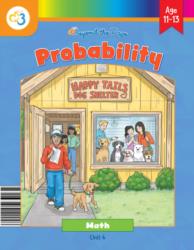
Unit 4: Probability
Lesson 1
What Is Probability?
Students calculate theoretical probabilities for fair coins and dice (e.g., recognizing the coin sample space {Heads, Tails} and computing 1 out of 2 = 0.5 = 50% and the die outcome 1/6). Students list complete sample spaces for chance situations (spinners, dice, marbles) and identify favorable outcomes using curly-brace notation. Students apply the formula Probability = number of favorable outcomes / total outcomes (used explicitly with the spinner activity) and convert probabilities between fraction, decimal, and percent. Students also compare experimental results to theoretical expectations by recording coin toss trials and observing how experimental probabilities approach the theoretical model as trials increase.
Lesson 2
Observing Probability
Students work with a 12‑section spinner (7 red, 3 blue, 2 yellow), record tallies for 10, 50, and 100 spins, and compute experimental probabilities as fractions, decimals, and percents. The Student Activity Page directs students to use theoretical probability to predict outcomes for 600 spins and provides space to compute predicted counts for each color. The Mixed Review includes items asking for coin probability (0.5) and a short answer asking students to explain the difference between theoretical and experimental probability.
Lesson 3
Probability Models
Students are taught that a uniform event gives each outcome equal likelihood (e.g., "If the event is uniform... flipping a fair coin — heads and tails are each a 1 out of 2 chance"). Students explicitly list sample spaces and assign equal probabilities in multiple uniform examples: the die activity defines sample space {1,2,3,4,5,6} and uses P(4)=1/6 with predictions for 30, 60, and 120 rolls. The 'Making Predictions' problem set (Problems 1–10) and worked examples show students building uniform probability models (marbles, spinners, 6-sided and 10-sided dice) and computing probabilities like P(Cara)=1/3 for selecting a name from a hat.
Lesson 4
Compound Events
Students build complete sample spaces for compound events using lists, tables, and tree diagrams (e.g., S = {(J,C), (J,K), ...}). The lesson explicitly assumes equally likely outcomes in multiple examples and writes equal probabilities (for example, assigning 1/6 = 16.7% to each outcome in the snack example). Student activities repeatedly ask learners to count favorable outcomes out of the total and write probabilities as fractions and percents (tasks ask for probability fraction, percent, and expected frequency).
Lesson 5
Simulations
Students set up a uniform sample space by assigning the digits 0–9 on a 10-sided die to categories (e.g., Pop = 0–3, Instrumental = 9) and told that each digit represents one song or visitor. Students run repeated trials (rolls) using that number assignment, record the number of rolls until a target outcome occurs, and compute frequencies, totals, and averages across 20 trials. In the Library Hunt and Visitor activities, students count how many trials meet a condition (e.g., 4 or more rolls) and convert the fraction of trials to a percent to report the simulated probability.
Lesson 6
Unit 4 Test
Students compute theoretical probabilities for uniform situations such as flipping a coin (1/2) and rolling a six-sided die (1/6). Students list sample spaces and work with spinners that have equal sections (e.g., a spinner with four equal sections Red, Blue, Green, Yellow) and use those to find probabilities. The unit text and parent notes explicitly state learning goals to "understand when all outcomes are equally likely and build a uniform probability model" and include problems that ask students to create and use probability models to find event probabilities.
Final Project
Happy Tails Dog Shelter
Students create and list a full sample space of 30 sex×size×color combinations and represent it as a list, tables, and a tree diagram. They place events on a probability line and are prompted to identify an "equal chance" event; the sample answer explicitly shows "They meet a male dog" as equal chance because there are 30 males and 30 females. Students build a probability model for size+color by using shelter counts to compute probabilities (e.g., 3/60 × 100 = 5%) and answer questions that use those computed probabilities.
Unit 8: Data
Lesson 5
Categorical Data
Students compute relative frequencies and convert two‑way frequency tables into proportions (Activity 4 and Day 3). The lesson shows students calculating probabilities from data, e.g., finding the probability a biker caught a cold by computing 18/90 = 0.20 and filling row‑ or column‑relative frequency tables. Multiple activities require students to express cell values as decimals or percentages and to use those proportions to compare how likely events are across groups.
Unit 9: Semester Exams
Lesson 4
Probability Review
Students are asked to create probability models for spinners with equal sections (e.g., a spinner with 5 equal sections labeled A–E) and to find probabilities such as P(C) = 1/5; the answer key explicitly states each outcome has probability 1/5. Students are asked to explain how a spinner with 10 equal sections could model a 40% probability, which requires assigning equal probability to each section and converting to percent. Students count letters A–Z and compute the probability of drawing a consonant (21/26), which uses a uniform assumption that each letter is equally likely.
Lesson 5
Semester Exam
Students compute theoretical probabilities and build probability models in multiple items: Problem 39 has students find the probability of drawing a blue marble from a 3-5-2 bag (answer 3/10), Problem 40 asks for the probability of rolling >5 on a fair 8-sided die, and Problems 41–42 require listing the sample space for a coin combined with a 4-section spinner and computing the probability of tails and C (answer 1/8). Problem 47 has students use the 36 equally likely ordered outcomes of two six-sided dice to find the probability the sum is 9 (answer 4/36 = 1/9). Problem 49 explicitly asks students to explain how a spinner with 10 equal sections models 40%, and Problem 44 asks students to create a probability model for a bag with 5 stars, 3 circles, and 2 squares.