


Sixth Grade - MATH
5: Math
Unit 3: Ratios and Percentages
Lesson 1
Introduction to Ratios
Students practice writing ratios in three forms (in words, with a colon, and as a fraction) on multiple activity pages, including the "Showing Ratios" table and the RATIOS activity page. In the "Think About It" blueberry pie example students write the ratio 4 cups of blueberries to 1 cup of sugar in all three forms (4 to 1; 4:1; 4/1), and several word problems (bread recipe, cleaning solution, piano vs. soccer) require students to scale ratios by multiplying or dividing both quantities. The Equivalent Ratios activity explicitly has students generate equivalent ratios by multiplying/dividing both parts, which practices the arithmetic used when finding per-one relationships by scaling.
Lesson 2
Describing Ratios in Words and Pictures
Students draw and describe multiple ratio situations (bottles, toast and eggs, puppies, pizza) and are asked to express ratios in words, numbers, and pictures. The lesson has students write ratios in three forms including fraction notation (e.g., 1 to 2, 1:2, or 1/2 for toast to eggs) and to reduce ratios to equivalent smaller ratios (e.g., 12 red pens to 21 blue pens → 4:7). Parent guidance and activities prompt students to name ratio types (part-to-part, part-to-whole, whole-to-part) and to explain ratios in context using words and numeric forms.
Lesson 3
Equivalent Ratios
Students solve problems that involve relationships between two quantities (rate contexts) such as "2 sodas cost $5" (find cost for 6 sodas), basil plants (8 plants cost $24, find cost for 2), and a running example (100 meters in 20 seconds, find time for 20 meters). The materials repeatedly use "for every" phrasing (e.g., four hamsters for every ten fish; 7 regular to 2 decaf) and provide tasks using double number lines, tables, and graphs to scale ratios. Several tasks ask students to fill tables or compute corresponding values (e.g., pitchers of lemonade and lemons: (1,6) leading to (4,24)), which requires proportional reasoning in rate-like situations.
Lesson 4
Unit Rates
Students read an explicit definition of unit rate and unit price and see multiple contextual examples labeled with rate language (e.g., "45 miles per hour," "13 calories per chip," "$1.75 per quart"). Students are guided to convert a ratio to a unit rate both by making an equivalent ratio with a denominator of 1 (double number line/tape diagram language and examples) and by dividing the numerator by the denominator (fraction/division method). Students complete many practice problems and a quiz that require them to compute unit rates, express answers with "per" language, and apply unit rates to further computations (e.g., multiply unit rate by a number of units to find totals).
Lesson 5
Percentages
The lesson explicitly teaches the meaning of "per" as a relationship between two numbers and frames percentages as a ratio "parts out of 100," showing percent as a unit rate per 100. The Basic Skills Review includes a unit-price problem (14 ounces for $3.92) and shows the student procedure of dividing both numbers in the ratio 14:3.92 to get an equivalent ratio of 1:0.28, demonstrating how to compute a unit rate. The lesson also explains that the fraction bar signifies division, linking a/b to the operation used to form unit rates.
Lesson 6
Percentage Problems
The lesson repeatedly represents percentages as part-to-whole ratios (e.g., "A percentage represents a part-to-whole ratio") and has students make equivalent ratios using double number line diagrams to solve percent problems. Students set up and solve equations in the form part = percent × whole and convert percents to decimals (e.g., x = 0.25 × 600) when finding amounts. The Parent Plan and skills list also state students will "Find a percent of a quantity as a rate per 100" and "Use ratio and rate reasoning... by reasoning about tables of equivalent ratios, tape diagrams, double number line diagrams, or equations."
Lesson 7
Unit Conversions
Students practice writing and using conversion ratios that include a single unit (e.g., 1 quart = 2 pints, 1 ounce ≈ 28.35 grams, 12 inches = 1 foot) and create an Interactive Notebook page organizing those unit ratios. Students use double number line diagrams and equivalent-ratio setups to scale from a given quantity (e.g., 3 quarts → 6 pints, 19 cm → 190 mm, 5 oz → 141.75 g). Several activities require students to set up ratios with the unit of 1 and multiply or divide to find the corresponding value in the other unit.
Lesson 8
Unit 3 Test
Students are asked to calculate and interpret unit rates in multiple problems: Braden's speed (19 miles in 2 hours → miles per hour), peaches sold at $5.16 for 4 pounds → unit price per pound, machine produces 1,200 pieces in 40 minutes → pieces per minute, and unit price problems for roses and chocolate milk. The unit-rate concept is explicitly included in the skills list and matching/definition activities where "Unit Rate" is defined as a ratio showing the amount of one thing per a single unit of another. Several tasks require students to express answers using rate language (e.g., "miles per hour," "$ per pound," "pieces per minute") and to set up equivalent ratios/tables/graphs to find unit rates.
Final Project
What's the Best Buy?
Students set up and compute unit prices by dividing total cost by number of units (Activity 3), with a worked example showing $3.38 ÷ 13 oz = $0.26 per ounce. The milk example has students convert units with equivalent ratios (gallon → fl oz) and then express and compare prices as dollars per fluid ounce. Step Three and the data tables require students to record ratios and unit prices (price per unit) and mark the best buy; the "Ratios All Around" tasks also ask students to use a distance/time rate (1 mile every 6 minutes) and recipe ingredient-per-serving ratios.
Unit 4: Algebraic Expressions
Lesson 1
Introduction to Algebra
Students translate rate-language situations into multiplicative expressions such as 5n for "$5 for every car you wash" and 5n for "5 pencils in a pack... n packs." Students also write expressions like 20n to represent "20 minutes at each practice," and the activities ask students to translate word phrases (including "per" and division clues) into algebraic expressions. The student pages and answer keys explicitly model "constant times variable" for contexts that have a "per" relationship.
Lesson 3
Working With Expressions
Students translate rate language such as "earns $3 for each dog" and "earns $10 for every hour" into algebraic expressions (3n, 10n) and evaluate them (Josie walks 7 dogs → 3·7 = 21). Students also write division expressions that represent "per friend" situations (Piper: 24/n) and the challenge ((n − 3)/2) which represent quantities per one person. The Basic Skills Review and activity pages include ratio-style problems that require students to set up and use these per-unit expressions.
Lesson 5
Equivalent Expressions
The Basic Skills Review #8 asks students to find how many push-ups Elias did per minute (42 push-ups in 3 minutes) and to use that rate to find how many push-ups in a given time, requiring computation of a unit rate and scaling. The review instructions also tell students to include unit labels in answers (e.g., inches or centimeters), reinforcing attention to units when reporting rates.
Lesson 7
Unit 4 Test
Students translate rate language into algebraic expressions in multiple problems: they choose 12n + 5 for Zane who earns $12 per hour and $5 per paycheck, and they choose 5x + 3 for Jeremiah who earns $5 for every dog walked plus a $3 tip. Students also work with Alana's expression 12(x + 6) to represent beads needed for 12 bags, and use the distributive property to write 12x + 72. These items require students to interpret "per" or "for every" as multiplication by a unit rate.
Unit 5: Algebraic Equations
Lesson 1
Algebraic Equations
Students translate word problems that use per-unit language into equations such as m/6 = 20 (marbles divided evenly into 6 bags) and p/2 = 85 (2 pills per dose for 85 doses). Students also work with statements like "Each notebook cost $3" and "each bag held 20 marbles" and form equations (3x = 24, m/6 = 20) that reflect multiplicative per-unit relationships. Several activity items ask students to interpret "each" or "per" wording when writing and solving equations (e.g., 3x = 30 for "three times as many" and the medicine/pills problem).
Lesson 3
Solving One-Step Equations, Part 2
Students draw tape and hanger diagrams to split totals into equal groups and solve equations such as 2n = 8 (finding n = 4) and n/2 = 5 (finding n = 10), explicitly reasoning that "each group has a value of 5." Students translate word problems with "for every" language (e.g., "He earns $12 for every car that he washes") into equations like 12y = 96 and solve for the number of cars. The lesson repeatedly has students divide a total by the number of groups to find the value of one group, and students check solutions by substitution.
Lesson 6
Solving Inequalities
Students set up and solve the Gabriel word problem 5n ≤ 75 to find n ≤ 15, answering "How much money could Gabriel have earned each week?" which requires finding a per-week amount. Students also solve the Mayor Johnson problem n/3 ≥ 25 that uses language about an equal division "among 3 jars" and interprets the per-jar amount. Several activity items ask for values "each week" or "each jar," prompting students to divide totals by counts when solving the inequalities.
Lesson 7
Independent and Dependent Variables
The lesson defines a unit rate as a ratio showing the amount of one thing per a single unit of another and gives the driving example: Tonya travels 45 miles in one hour, so the unit rate is 45:1. It uses rate language and ‘‘per'' in several real contexts (Kevin earns $10 per hour; Ron bikes 5 miles per hour) and represents those rates with equations (10x = y, 5x = y). The recipe example (15 cookies per 1 egg, 15:1) and statements that the constant (e.g., 45) is the number per single unit directly connect ratios to unit rates.
Final Project
All About Me
The materials include rate-style phrasing such as "I earn more than $5 a week for chores," which expresses money per time. The two-variable example 2x = y ("I practice piano (y) twice as long as I practice soccer (x)") asks students to solve for one quantity given the other and to create an independent/dependent variable equation with a corresponding table and description. Students are asked to use variables to represent two quantities in a real-world problem and to describe how y changes as x increases or decreases.
Unit 6: 2D Geometry
Lesson 2
Working With Angles
The Basic Skills Review #11 includes Problem 5: "A candy-making machine can produce 208 gumdrops in 4 minutes. Use equivalent ratios to determine how many gumdrops the machine can make in 1 minute," which asks students to compute a per-one-minute value. The answer key shows the computation and result (52 gumdrops), demonstrating students convert a ratio to a unit rate. The review directions also remind students to include unit labels when appropriate, which connects to expressing rates with units.
Lesson 4
Area
Students solve real-world division problems that use ratios of quantities: they convert units and divide total area by the area of one paver (24n = 4320, n = 180) to find how many pavers are needed, and they divide total garden area by coverage per seed package (54 ÷ 3 = 18) to find how many packages are required. The lesson presents the statement "Each package of seeds covers 3 square feet" and uses that number algebraically to compute the required number of packages. These tasks require forming and solving quotients relating two quantities.
Lesson 5
Circles
Students measure the circumference and diameter of three circles, then use a calculator to divide circumference by diameter and record the quotient (c/d) rounded to two decimals. The lesson explicitly presents pi as the ratio pi = C/d and has students compute C/d to observe a value close to 3.14. Activity 2 shows the algebraic relationship pi = C/d and uses that ratio to derive C = πd, so students work directly with a quotient associated with a ratio.
Lesson 6
Scale Drawings
Students convert scale ratios to a per-one relationship in multiple places (for example, 8 cm on the drawing represent 2 m in the garden, which the text simplifies to 4 cm per 1 m). The lesson has students write a ratio of scale drawing length over original length and simplify it (for example 15/5 = 3/1 and 4/16 = 1/4) and explicitly interprets those results as "3 units in the scale drawing represent 1 unit in the original" or "1 cm/4 feet." Several problems require using that per-one relationship to compute unknown measures (e.g., architect 1 cm/4 ft → 120 ft = 30 cm).
Lesson 7
Unit 6 Test
Students calculate and use ratios as scale factors in multiple problems (e.g., finding the reduction scale 4/12 = 1/3 for the bird's nest and using a 1/3 scale to redraw a rectangle). Students compute and compare ratios of perimeters and areas (e.g., showing 42/14 = 3/1 for perimeter scale factor and area scale factor 9/1). Students solve practical division problems that use a ratio relationship to find counts (e.g., dividing the fire ring area by 3.5 square feet per bag to find how many bags are needed).
Unit 7: 3D Geometry
Lesson 2
Surface Area
The Basic Skills Review asks students to find the unit price per ounce for a 24-ounce bottle costing $3.12 and the answer key shows the work: "Write equivalent ratios: 24 oz/$3.12 = 1 oz/n. Divide both parts of the ratio by 24 to get 1 oz/$0.13." The grapes problem (2.5 lb at $1.58 per pound) requires using a unit price to find a total cost, applying rate reasoning in context.
Lesson 5
Problem Solving With Solids
Students divide a total quantity by an amount-per-unit in multiple places: Archie divides 528 in.^2 by 275 in.^2 (coverage per package) to find how many packages of paper are needed. Other problems require dividing total volume by volume per item (e.g., 45,000 cm^3 ÷ 600 cm^3 to find how many boxes of salt, 3,375 in.^3 ÷ 300 in.^3 to find how many puzzles fit). Several activity answers show students computing counts by dividing a total measurement by a single-item measurement.
Lesson 6
Unit 7 Test
Students solve real-world problems that state a per-unit coverage and require division to find quantities: e.g., "one can of paint can cover 10 square feet" (Kareem paint problem) and "one roll of decorative paper covers 3,000 square inches" (shop owner decorative paper problem). In those tasks students compute how many cans or how many boxes can be covered by dividing a total area by the given single-unit coverage. The problems present rate language that associates an amount of area with a single unit (per can, per roll).
Unit 8: Statistics
Lesson 2
Populations and Samples
Students work a Basic Skills problem that describes a candy factory producing 85 pieces of gum per minute and are asked to find how many pieces are produced in 12 minutes. The answer key explicitly states "The rate is 85:1" and shows multiplying both parts of the ratio to get 1,020:12. The Basic Skills instructions also remind students to include unit labels in answers.
Lesson 6
Measures of Center
Students repeatedly compute a mean by adding all data values and dividing by the number of values (for example, 219 ÷ 15 = 14.6 for the swimmers' ages). Multiple activities ask students to find the mean from frequency tables, dot plots, and stem-and-leaf plots, and steps explicitly instruct students to divide the sum by the count to get an average. Graph labels such as "Hours Per Week" also present quantities in a per-one format.
Lesson 8
Making Inferences
Students write part-to-whole ratios for candy colors (e.g., sample example shows the ratio 3:10) and convert those ratios into percentages. A Basic Skills Review problem has students take the ratio 600:8 and divide to get the unit rate 75:1, labeled as 75 miles per hour in the answer key. The food-truck activity uses the sample mean ($25) to infer total sales for 100 customers (about $2,500), implicitly using a dollars-per-customer rate.
Lesson 9
Comparing Populations
Students compute and use the formula "(larger mean − smaller mean) ÷ (highest mean absolute deviation)" and carry out the division (examples show 1.5 ÷ 1.2 = 1.25 and 8 ÷ 1.6 = 5). Students calculate means and mean absolute deviations for two data sets and then divide one quantity by another to produce a single comparative number described as a multiple of variability. The Parent Plan and student pages explicitly prompt students to "use a mathematical ratio to compare populations."
Unit 9: Skills Review
Lesson 2
Fractions, Ratios, and Coordinates
Activity 2 includes multiple real-world ratio and rate problems that require students to find per-one rates. Problem 6 asks students to find the train's speed by dividing 310 miles by 5 hours and the answer key shows reducing 310:5 to 62:1 and labeling the result as 62 mph. Problem 7 asks for the unit price of apples (3 pounds for $6.12) and the answer key shows dividing the ratio 3:6.12 to get 1:2.04 ($2.04 per pound).
Lesson 3
Expressions, Equations, and Percentages
Students work with contexts that use rate language: Problem 5 in Activity 1 has students write and evaluate the expression 9n + 3 for Marie who makes $9 per hour (students compute total pay for 7 hours). Activity 2 includes a word problem where Naomi earned $5 for each hour and students write and solve the equation 5n + 3 = 18. The Parent Plan skills also list finding a percent as a rate per 100 and using ratio reasoning to convert measurement units, and the wrapping-up link directs students to practice percentages and unit conversions.
Lesson 4
Geometry
Students solve problems that set up and compute ratios and scale factors: they enlarge a triangle using a scale factor of 2/1 (Problem 3) and find a scale factor by writing a ratio 4/12 = 1/3 from corresponding rectangle parts (Problem 4). Students also use percent scaling and set up equivalent ratios (100/800 = 2/n) to find a new height (Problem 5). These items require students to form and manipulate ratios and to compute numeric quotients that represent multiplicative comparisons.
3: Math
Unit 1: Numbers
Lesson 1
Positive and Negative Rational Numbers
Students compute and interpret rates in multiple activities: Activity 3 asks students to find how much temperature decreases at 2.5 degrees per hour over 3.5 hours and includes the word "per hour." Activity 4's Real-World Contexts worksheet includes prompts like "You lose $4.25 per week for 3 weeks" and temperature drops per hour, and students multiply or divide to find total change. Activity 6 and several division problems have students divide totals (e.g., −60 ÷ 5 = −12) to determine amounts per person, with explicit statements about each person owing −$12.
Lesson 6
Scientific Notation
Students work with quantities given as "per" amounts and compute per-unit values in multiple problems (e.g., Example: 1.13 × 10^8 grains of rice per pound used to find total grains in 50 pounds; Example: 1.2 × 10^3 liters per minute for a fire hose used to find liters per hour). Several activity problems require dividing totals by counts to find a per-unit measure (e.g., a tank with 4 × 10^5 liters refueling 2 × 10^3 trucks asks for liters per truck; a weekly package total divided by days to get packages per day). The directions and word problems consistently use rate language such as "per," "per minute," and "miles a day," and students perform the arithmetic (multiply or divide) to interpret and use those rates.
Lesson 7
Arctic Marine Research
Students are given explicit rates in Phase 1 (e.g., "1.2 x 10^8 cells per ounce" and "9.5 x 10^7 cells per ounce") and are asked to compare the number of cells in equal tissue samples, which requires interpreting quantities stated with "per." Students are also asked to calculate how many times larger one cell measurement is compared to another (cod vs. sponge), which requires forming and evaluating a ratio (division) between two quantities.
Final Project
Mars Station Test Mission
Students are asked in Task 1 to determine energy use per hour, per day, and per year for each location, producing values like "32 kWh per hour, 768 kWh per day, 280,320 kWh per year." Task 2 and its answer key require calculating energy produced by a given number of solar panels and wind turbines (e.g., solar output per day and per year, wind output per day and per year), which involves computing and comparing per-unit time rates. Task 3 converts a fuel-cell quantity given in scientific notation (7 × 10^2 kWh) to 700 kWh per fuel cell and has students divide the energy shortfall by the 700 kWh to find how many fuel cells are needed. The supply/logistics tasks use rates in money-per-unit contexts (cost per kg and cost per meter of radius) and ask students to compute total costs from those unit rates.
Unit 2: Proportions
Lesson 2
Unit Rates
Students are introduced to the meaning of a unit rate as "how much for one" in the "Things to Know" section and Activity 1 directs them to set up a labeled fraction, divide the numerator by the denominator, and label the result (e.g., $4.99/6 apples = $0.83 per apple). Activity 3 gives explicit examples of dividing fractional quantities (3/4 miles ÷ 1/2 hours using Keep-Change-Flip) to produce a unit rate in miles per hour. Activities 2, 4, and 5 provide many real-world contexts (prices, speed, area, lengths) where students compute and compare unit rates and express answers using "per" language.
Lesson 3
Constant Rate
The lesson repeatedly teaches k = y/x and has students compute k from tables (Activity 2 tables with k values), from graphs by picking points and using k = y/x (Activity 3), and from equations by rewriting into y = kx to identify k (Activity 5). Real-world problems and examples ask for unit rates and use per-language explicitly (dog-walking pay, $10 per hour example, liters per minute, dollars per pound in Activity 6 and the Review Quiz asking price per pencil). The Parent Plan and Skills list explicitly state that students will "Understand the concept of a unit rate a/b" and practice identifying unit rates in tables, graphs, equations, and verbal descriptions.
Lesson 4
Graphing Proportions
The lesson repeatedly defines the unit rate as the constant k in y = kx and highlights the point (1, k) as the unit rate (Things to Know; Activity 1 image; Day 2 explanations). Multiple activities ask students to find the unit rate from graphs, tables, and equations (e.g., Graph 1–6 questions, Jim walking dogs y = 12x, Graphing Equations examples). Several real-world contexts require students to state rates using rate language (earn $10 per hour, $12 per hour, miles per hour, $ per t-shirt, $ per pizza) and Activity 6 explicitly has students check y/x for equivalent ratios.
Lesson 5
Proportional Relationship Equations
Students write equations in the form t = p × n and are told that the unit rate k is the price per item (for example, Step 1: "Since each ticket costs $12, this means that the unit rate (k) is 12. We can write: t = 12n"). Review and quiz items explicitly ask students to compute unit rates in context (e.g., "Compute the unit rate if a car travels 3/4 miles in 1/2 hour" and "A 12-ounce can of soda costs $1.50. What is the unit price per ounce?"). Multiple activities require students to interpret the unit rate from graphs and the point (1, y), write equations y = kx, and explain unit-rate language in real-world contexts such as recipes, cost per item, calories per minute, and distance per hour.
Lesson 6
Taxes, Tips, and Commissions
Students compute amounts using rates written as percentages (e.g., Sales Tax = Price × Tax Rate; Tip Amount = Original Bill × Tip Percentage; Commission = Sales Amount × Commission Percentage). Several problems use "per" language and unit-like contexts (e.g., "A restaurant charges $1.50 per person," base salary of $2,000/month, and problems asking for cost per person). Students also work backward by dividing by a rate (e.g., solving 1.08x = total or commission = rate × sales and then dividing to find sales).
Lesson 8
Simple Interest and Percent Error
Students work with the simple interest formula I = Prt and are asked to interpret r as the annual interest rate written as a decimal. Several problems require students to solve for r by isolating and dividing (for example r = 250 / 5000 = 0.05 = 5%), which yields a per‑year rate. The materials repeatedly use rate language such as "4% simple interest per year" and ask students to compute interest earned per time period.
Lesson 9
Unit 2 Test
The skills list explicitly tells students to "Compute unit rates associated with ratios of fractions, including ratios of lengths, areas and other quantities measured in like or different units" and to "Identify the constant of proportionality (unit rate) in tables, graphs, equations, diagrams, and verbal descriptions." Multiple student tasks ask students to find unit rates in context (e.g., 3/4 mile in 1/2 hour; 5/6 mile in 2/3 hour; 60 miles in 1.5 hours) and to express prices per item (price per shirt, price per muffin). Problems also ask students to interpret graph points such as (0,0) and (1,r), write equations in y = kx form, and label rates with "per" language (miles per hour, dollars per item).
Final Project
Lemonade Stand
Students are asked to compute unit prices for lemons using a unit rate formula (find $ per lemon for individual and bulk prices) and to calculate unit price per pound for sugar by dividing total cost by 2. Students calculate cost per cup by dividing total cost for one gallon by 16 and are reminded to add the per-cup cost of disposable cups. Students create tables and graphs, write equations in the form y = kx to model proportional relationships, and answer interpretive questions linking line steepness and the flattest line to lower price per lemon.
Unit 3: Expressions
Lesson 2
Rewriting Expressions
Students work with explicit rate language such as "$3 for each ride" and "Variable Cost per Item × Number of Items," and they set up and evaluate expressions like Total Cost = 25 + 3r and compute 25 + 3×5 = 40. Students rewrite percentage situations using multiplicative rate factors (e.g., Total Price = Original Price × (1 + Sales Tax Rate) and use 1.05 × 40 = 42). Activity problems require students to multiply a per-item cost by a quantity in many contexts (tax, discounts, markups, fixed plus variable costs).
Lesson 3
Algebraic Expressions
Students set up and solve equations that use "cost per" language, for example defining c = cost per pack ($4) and writing t = cp + s to solve the markers problem. In the Ferris wheel example students use r = cost per ride ($2) and write s = r(m + t) to compute total cost or solve for an unknown number of rides. Activity pages require students to work with unit-pricing contexts (packs of markers, rides, tickets, T-shirts) and to perform multiplication or division that uses a per-unit amount.
Lesson 4
Graphing Proportions
Students are shown explicit definitions and procedures: the "Things to Know" section defines the unit rate and states it is found by dividing y by x, and Activity 2 gives worked examples (6 miles in 3 hours → 2 miles/hour; $9 for 3 pounds → $3/pound). Students practice identifying unit rates from graphs and tables in multiple activity pages (e.g., graphs with points like (2,8), (4,12) and real-world scenarios such as miles per hour and cost per item). Activities require students to compute k in y = kx by dividing y by x, to state unit rates in contextual language (dollars per hamburger, miles per hour), and to translate between graphs, tables, and equations.
Lesson 5
More Graphing Proportions
Students repeatedly find unit rates by dividing y by x in tables (e.g., road-trip miles ÷ hours, candy price ÷ number of candies) and by identifying the slope m in equations written as y = mx. The lesson explicitly tells students that the unit rate is the y-value when x = 1 and gives graph-based tasks where students read the y-value at x = 1 and compare steepness to determine which rate is larger. Multiple activities (walking speeds, pancakes, faucets, marbles, candy prices, marbles/jars, etc.) require students to compute, compare, and interpret unit rates using 'per' language like miles per hour, dollars per candy, or cups per milk.
Lesson 7
Rise Over Run
Students pick two lattice points, draw right triangles, count the vertical change (rise) and horizontal change (run), and compute slope by dividing rise by run (e.g., +4/+4 = 1). The activity pages require students to fill in RISE and RUN boxes and simplify the fraction to find slope for multiple example pairs (including signed values like (-)3/+4 = (-)3/4). Activities ask students to set up proportions comparing rise/run for different triangles to show equality of ratios and to determine triangle similarity.
Lesson 8
y = mx + b
The lesson repeatedly identifies slope (m) as a rate of change and teaches m = (change in y)/(change in x), with activities that require students to compute slope from two points and from tables. Students practice finding the slope from tables (looking for how much y changes when x increases) and then write equations y = mx + b, explicitly interpreting m in real-world contexts (e.g., $10 per hour, $1.50 per mile, $3 per movie). Multiple activities ask students to state the slope as a per‑one‑unit rate (e.g., "m = 2 means up 2 for every 1 to the right") and to use rate language like dollars/hour or cost per mile.
Lesson 9
Unit 3 Test
Students work with tables of quantities and money (e.g., babysitting: 1 hr $10, 2 hr $20; car rental: 1 day $50, 2 day $100) and are asked to determine if the relationship is proportional, find the slope, and write an equation (y = mx). Several word problems use explicit per-unit language (e.g., "You're earning $12/hour plus a $20 bonus", "$30 startup fee and $10 per GB") requiring students to interpret and use rates in context. The unit objectives explicitly direct students to "Interpret unit rates and slopes from tables and graphs" and to compare rates ("Which line has a greater rate of change?").
Final Project
Planes, Trains, and Automobiles
Students compute and use unit rates when they write equations in the form y = mx with m labeled as speed (miles per hour) and fill tables and graphs showing distance per hour for car, train, and plane. Students interpret slope as a unit rate in graphing questions (e.g., rise/run for the train = 80, identify fastest/slowest by slope) and solve problems that produce per‑unit values (time = distance ÷ speed). In the cost section students calculate and use cost-per-mile rates (e.g., y = 0.15x + 31.50, 0.20x, 0.50x) and answer which method has the steepest slope meaning highest cost per mile.
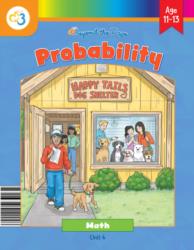
Unit 4: Probability
Lesson 1
What Is Probability?
Students compute probabilities using the formula "Probability = Number of favorable outcomes / Total outcomes" (e.g., coin: 1 out of 2 → 1/2 → 0.5 → 50%; spinner: 6 out of 12 → 6/12 → 1/2 → 50%). Activities ask students to record counts (e.g., 6 heads out of 10), convert those counts to fractions, decimals, and percents, and place probability values on a 0-to-1 number line. Student tasks require using ratios of counts to total outcomes and converting those ratios into a per-one probability representation.
Lesson 2
Observing Probability
Students compute experimental probability using the formula Number of times it happened / Total number of spins and express the result as a fraction, decimal, and percent (Step 2). Students use the resulting probability (e.g., 59/100 = 0.59) to make predictions by multiplying the probability by 600 to get expected counts out of 600. The activities repeatedly frame outcomes as frequencies "out of" a total and ask students to record tallies and relative frequency across trials.
Lesson 3
Probability Models
Students compute probabilities using the formula Probability = number in a given group / total number of items (e.g., "Probability = Number of items in a given group / Total number of items"). Students use that ratio as a value to make predictions by multiplying by the number of trials (examples: P(2)=1/6 × 120 = 20; expected heads = 1/2 × 500 = 250). Students also calculate experimental probabilities as counts per total (e.g., Probability of a color = 29/50 = 0.58), which treats outcomes as a quantity per number of trials.
Lesson 4
Compound Events
Students compute probabilities as fractions and convert them to percents (for example, finding 1/6 = 16.7%). They apply those ratios to predict counts over repeated trials (for example, 16.7% of 120 → expect 20 occurrences). In the Making Inferences activity students compute a sample proportion 14/60 ≈ 23.3% and multiply by the total population 1,143 to estimate about 266 students.
Final Project
Happy Tails Dog Shelter
Students compute probabilities by writing the number in a group over the total (for example, using the formula Percentage = Number of dogs in the group / 60 × 100) and complete probability entries such as (Medium, White) = 9/60 = 15%. Students place events on a probability line labeled 0, 0.5, and 1 and identify an equal-chance event (0.5) such as meeting a male dog when counts are equal. Students add counts across categories (e.g., total medium dogs = 30/60 = 50%) to determine likelihoods.
Unit 5: Functions
Lesson 1
What Is a Function?
The lesson explicitly states that "linear functions change at a constant rate" and uses examples such as y = 2x + 1 where students calculate tables showing that "each time you increase x by 1, the y value increases by the same amount (in this case, it goes up by 2 every time)." Students complete input/output tables and graph linear rules (e.g., y = 2x - 3, y = 2x + 1) and observe consistent change in y for unit changes in x. Several activities have students compute outputs for given inputs, highlighting the change in output per one-unit change in input.
Lesson 2
Linear and Nonlinear
Students compute and use the rate of change formula (y2 - y1)/(x2 - x1) in tables and are directed to check the change in y as x increases by 1. The lesson gives concrete examples such as "Every minute, you take 100 steps" and the y = 2x + 4 table/graph where students observe that y increases by 2 for every 1 increase in x (rise of 2 units for every 1 unit of run). Student activity pages require filling tables and calculating the rate of change between successive x-values to decide if relationships are linear.
Lesson 3
Understanding Functions
Students read and use explicit rate language in multiple activities (e.g., "Sylvia climbed at a rate of 4 feet per hour" and later 5 feet per hour; Timmy "crawls at 2 meters per minute"; Bella "ascends steadily at 6 meters per minute"). Students plot points over time using those rates, label axes (time and distance/height), and calculate positions at each hour or minute to create the graphs (e.g., plotting Sylvia at (1,4), (2,8), etc.). Several graphing scenarios ask students to use the given per-unit rates to determine how far or how high the object is after each unit of time.
Lesson 5
Slope
Students are taught the slope formula Slope = rise/run and Slope = Δy/Δx and use it to compute a ratio of changes between two quantities. Examples show students finding slope from two points and from tables (e.g., slope = 2 meaning "every time x increases by 1, y increases by 2"), and interpret slope as "goes down 2 for every 1 step right." The lesson also explicitly notes that vertical lines have undefined slope because the run would be zero, addressing the b ≠ 0 restriction.
Lesson 6
Slope-Intercept Form
Students compute slope using the formula m = (y2 - y1)/(x2 - x1) in multiple activities (graphs, tables, and two-point examples). In the Table to Equation example students calculate m = 1/5 and the text explicitly interprets this as 0.2 miles per minute and then converts it to 12 miles per hour, using "per" language. Activity directions repeatedly ask students to find the slope (rate of change) from tables and interpret it in context (e.g., distance over time).
Lesson 7
Creating Functions
Students compute the rate of change using the slope formula and write it in per-unit language (e.g., "rate of change (slope) = 15 pages per hour," "$6 per chore," "cost increases by $3 for every additional hour"). They identify starting values and form functions in the form output = (slope) × input + (starting value) for story, table, and graph contexts (examples: A = 6c + 12, P = 15h, C = 3h + 5, F = 0.5s). Multiple activities require students to read tables and graphs, calculate the change in y divided by change in x, and interpret that quotient as the amount per one unit of input. The cooking activity has students create functions where ingredient amounts scale per serving (e.g., F = 0.5s), reinforcing unit-rate reasoning.
Lesson 8
Comparing Functions
Students compute unit rates by dividing quantity by time in multiple examples (e.g., Alex: 1.5 miles ÷ 30 minutes = 0.05 miles/min; Bella: slope 2 ÷ 30 = 0.067 miles/min). Students convert verbal rates and ratios to per-one-unit rates (Rider A: 4 miles every 20 minutes → 0.2 miles/min; Person B: 3 gallons every 2 minutes → 1.5 gallons/min). Students find rates from tables and equations (Taylor: (261−275) ÷ (4−0) = −3.5 dollars/week; Jordan: slope −3 dollars/week) and label rates with appropriate units (miles/minute, dollars/week, gallons/minute).
Lesson 9
Unit 5 Test
Students compute and express rates from tables and word problems (e.g., the train table with distances 60, 120, 180, 240 yields the answer "Rate of change = 60 miles per hour"). Multiple items ask students to write functions from unit rates (E = 12h; E = 15h) and the answer key records rates in "per" language (e.g., "60 miles per hour", "8 dollars per hour"). Several problems require finding the rate of change from data or comparing which function increases fastest, which has students determine a quantity per one unit.
Lesson 10
Final Project
Students create and answer yellow description cards that include real-world rate language (for example, "Emma earns $10 for each hour she babysits" and a car traveling at "60 miles per hour") and are asked to write equations and identify the slope or rate of change from those stories. Blue card examples present wage situations ("earned $15 per hour") and ask students to match equations to that rate language. Multiple card types and parent notes require students to determine rate of change from tables, graphs, and story descriptions and to interpret that rate in context.
Unit 6: Geometry
Lesson 1
Congruence and Similarity
Students compute scale factors by dividing corresponding side lengths (for example, Scale factor = larger side / smaller side = 6 ÷ 3 = 2). Students use that quotient to find missing side lengths (for example, 5 cm × 2 = 10 cm and x = 10 ÷ 2 = 5) and practice with scale factors like 1/2 and 1/3 across multiple problems. Numerous activities require students to set up and use the ratio of side lengths and apply multiplication or division to solve for unknowns in similar figures.
Lesson 6
Dilations
Students calculate a scale factor by dividing new coordinates or segment lengths by original values (steps show new x ÷ original x and scale factor = A′B′ ÷ AB). Activities require students to compute scale factors (e.g., 2, 0.5, 1.5, 0.33) from paired points and to multiply original side lengths by the scale factor to get new lengths (new length = original length × scale factor). Several problems and answer keys have students solve for unknowns using the equation new = original × scale factor and compute scale factors from given lengths.
Lesson 10
Volume
In the Life Application ice cream party activity students are asked to calculate the total volume of a tub, calculate the volume needed for each cone, and divide the total by the per-cone volume to determine how many friends/cones that amount supports. The lesson explicitly states that a cone holds exactly one-third as much as a cylinder with the same base and height, and students compute and compare those volumes (ratio of 1/3). Worked examples have students solve for missing measurements by dividing volume by πr^2 (for example solving 314 = 3.14×25×h to find h), which has students compute a quantity per unit of another quantity.
Unit 7: Linear Equations
Lesson 2
Multi-Step Equations
Students set up and solve multiple real-world equations that use rate language such as "per" and "each": examples include Mr. Patel's $3 per pound of chicken (4(y+2)=16 style), the Catering Costs ($8.75 per guest), Phone Plan ($0.15 per text), Running Track (1.5 miles per day), Water Tank (7.5 gallons per day), and the car rental ($0.25 per mile). The lesson explicitly tells students to look for words like "each" and "per" when writing equations, and students multiply a unit rate by the number of units when forming equations (e.g., 3c, 8.75g, 0.15t).
Lesson 4
Multi-Step Word Problems
Students work with multiple real-world contexts that use rate language ("per"): e.g., a van rental problem stating a $40 base fee plus $0.30 per mile asks students to solve for miles; phone-plan problems give costs as $25 plus $7 per GB versus $10 plus $8 per GB and ask students to compare/equate them; and problems compare hourly rates for mowing/weeding and split-a-bill scenarios that use per-person amounts.
Lesson 7
The Point of It All
Students work on word problems that describe a flat fee plus a per-unit charge (a delivery service with a flat fee and per-mile fee; a babysitting scenario with a flat fee and hourly rate), and they solve for the unknown quantity (miles or hours) given a total cost. Students also set up linear equations from those contexts (total = flat + rate * units) as part of the word-problem practice in Part 3. The activity pages ask students to write equations from context and solve for variables, which requires using per-unit rate information embedded in the problems.
Lesson 8
Linear Algebra In the Wild
Students define variables that explicitly represent prices or rates per unit (e.g., let x = price per pound of peach rings, let a = price of one apple, let x = number of hours and y = total cost). Multiple examples use rate language such as "$0.80 each," "$20 per hour," "$2 per movie," and "per pound," and students compute totals by multiplying the unit rate by quantity (e.g., 7 apples × $0.80 = $5.60). In break-even and candy-shop problems students solve for the unknowns that are interpreted as unit prices (peach rings = $4 per pound; apples = $2.00; banana = $0.40).
Lesson 9
Unit 7 Test
Students solve multiple word problems that use rate language such as "$12 per hour plus a $50 bonus" (Problem 20), "$25 per month plus $5 per class" (Problem 21), and "$2 per cup" for lemonade (Problem 22). Students also solve ticket-price problems that require finding the price per adult and child ticket from total costs (Problem 23), and several answer keys show unit prices as numeric results (e.g., adult = $9.00, child = $3.50). These activities require students to set up and solve equations that involve "per" language and unit costs.
Final Project
Getting Ready for College
Students write and use cost equations that include per-unit coefficients (e.g., C=225+0.60x and C=1.25x for transportation; C=5+1.5h and C=20 for streaming; y=5x+20 for phone plans), explicitly labeling units (months, miles, hours, GB). Students set those equations equal, solve for the variable, and graph both lines to find break-even points, interpreting the slope as a cost per one unit (per month, per mile, per hour, per GB). Students also divide shared costs to compute per-person rates (e.g., splitting apartment and furniture costs) and complete tables showing cost per unit values.
Unit 8: Data
Lesson 3
Constructing a Scatter Plot
Students plot paired numerical data (e.g., hours studied vs. test grade; study hours vs. practice problems) and answer questions that ask for expected change when the independent variable increases (e.g., "Each additional hour studied corresponds to approximately a 10% increase in test grade." and prompts like "Based on the scatterplot, how many practice problems solved would you predict for 5 hours?"). Multiple activities require students to describe how one variable changes with each increase in the other and to make per‑unit predictions (predicting a value for one more hour or for a specified single-unit increase). Several answer keys and interpretive prompts describe the relationship in per‑unit terms (e.g., "each additional hour… corresponds to…").
Lesson 4
Linear Models
Students calculate slope as a ratio using the slope formula m = (y2 − y1)/(x2 − x1) and then interpret that value as change in y per one unit of x (e.g., the ice cream example y = 2x + 50 where m = 2 is explained as "for every 1°F increase, 2 additional cones are sold"). The bird migration activity has students compute a slope by dividing total change (10) by number of days (4) to get a unit rate of 2.5 birds per day. Multiple problems ask students to state independent/dependent variables, find slope from two points, write y = mx + b, and explain the slope in "per‑unit" language (e.g., "for every week… 3 centimeters").
Lesson 5
Categorical Data
Students are taught the formula Relative Frequency = frequency of an event / total number of events and repeatedly calculate values like 18/90 = 0.20 (20%). Students convert two-way frequency tables into relative frequency tables (row- or column-based) and express entries as decimals or percents. Several activities ask students to compute these proportions and compare groups (e.g., comparing 20% of bikers vs. 25% of drivers).
Lesson 6
Unit 8 Test
Students work with linear models and slopes in context (several activities ask them to choose or write equations such as y=4x+0 or y=4x+2 and to match line B to an upward trend). The parent/skills list explicitly tells students to "use the equation of a linear model to solve problems in the context of bivariate measurement data, interpreting the slope and intercept," and gives the example of interpreting a slope as 1.5 cm/hr. Multiple scatterplot tasks use units (hours, mg/day, dollars, etc.) that present relationships that can be read as rates per unit.
Final Project
Collecting and Organizing Data
Students label a numerical axis as "Jumping Jacks in 1 Minute," which frames one variable as a per‑minute measure (a unit rate). Students convert tally counts to percentages and complete two‑way relative frequency tables where each cell is described as the percentage of all 20 people, using percent (per 100) language. The Parent Plan and activities ask students to use a linear model and interpret a slope (example given: "1.5 cm/hr"), which presents rate language using units per unit.
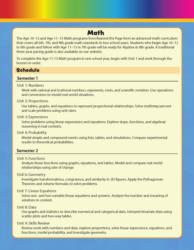
Unit 9: Semester Exams
Lesson 1
Numbers Review
Students solve division problems that compute a quantity per one unit: Question 10 has students calculate −45 ÷ 9 = −5 and interpret it as "the gamer lost 5 points per round," and Question 11 has students compute −72 ÷ 6 = −12 and interpret it as "each friend owes $12." The answer key explicitly frames these results in "per" language, showing students find and name the amount for each single unit.
Lesson 2
Proportions Review
The Parent Plan and activity descriptions explicitly require students to compute unit rates (e.g., convert 3 miles in 12 minutes to miles per hour, find cups of flour per batch) and to compare unit rates (Runner A vs B, who is faster). Activities ask students to identify the constant of proportionality in tables, equations (y = kx), and graphs and to interpret the point (1, r) as a unit rate (Activity 3 asks what (1,6) represents). Students are asked to write real-world situations, find the unit rate, and explain its meaning, and answer keys show explicit division to produce rates (e.g., 6 ÷ 1.5 = 4 mph, 2 ÷ 5 = 0.4 cups per batch).
Lesson 3
Expressions Review
Students are asked to find the slope and label it explicitly as the unit rate in Activity 2 (e.g., Babysitting Pay: table of hours and earnings asks "What is the slope (unit rate)?" and the answer key gives y = 14x and labels 14 as the unit rate). Multiple real-world contexts ask students to write equations and state what the slope represents (tutoring $40/hour, delivery service $12 flat fee + $18/hour, job pay comparisons in Activity 4). Activities require converting tables and graphs into equations of the form y = kx and interpreting k as cost per unit or earnings per hour, and students graph and compare those rates.
Lesson 4
Probability Review
Students compute probabilities using the ratio 'number of favorable outcomes ÷ total number of outcomes' (e.g., marble problem: 3/10; spinner: 7/25 = 0.28). Students express these ratios as fractions, decimals, and percents and explain what they mean in context (e.g., "3 out of every 10 selections would be blue"). Students also use expected-value reasoning by multiplying a theoretical probability by number of trials (e.g., 20 × 1/4 = 5 expected wins).
Lesson 5
Semester Exam
Students are asked explicitly to find unit rates in multiple problems: #14 asks for the unit rate for 4/5 mile in 1/2 hour (answer 1.6 miles per hour) and #15 asks for speed per hour for 18 miles in 3 hours (answer 6 miles per hour). Students identify proportional relationships and constants of proportionality in #16 and #17 (table with y = 5x and k = 5). Students extract unit rates from graphs and relationships in #19, #20, #34, and #35 by finding slopes, writing y = kx equations, and stating rates in context.
Lesson 6
Functions Review
Students calculate slope as a ratio of change (for example finding slope = 2 from points (2,1) and (6,9)) and are asked to explain the meaning of that slope in words as an amount per one unit. Students write functions from real-world rate language (e.g., write y = 18h for a delivery driver earning $18 per hour) and explain the slope as "amount earned per hour." Students work with contextual situations (bike rental, taxi) to identify and interpret the per-unit charge and distinguish starting fees from the per-unit rate.
Lesson 7
Geometry Review
Students find and use scale factors in similarity problems (e.g., given triangles with corresponding sides 5 and 10 students compute the scale factor = 10/5 = 2 and use it to find the other sides). Students compute a scale factor from a change in side length (e.g., shortest side 6 becomes 15, students compute 15 ÷ 6 = 2.5 and multiply other sides by 2.5). Directions explicitly prompt students to "use ratios to reason through each problem" when finding missing side lengths from dilations.
Lesson 8
Linear Equations Review
Students encounter explicit "per" language in real-world problems (e.g., "$2 per mile," "$4 per ride ticket," "$12 per month plus $3 per movie") and use those unit prices to write and solve linear equations. Students compute slopes as ratios in Activity 2 (for example, slope = (10 − 2) ÷ (7 − 3) = 2), which uses change-in-y over change-in-x. Students set up and solve equations that incorporate unit rates implicitly (for example, 6 + 2m = 34 and 25 + 15m = 100), applying rate language to model contexts.
Lesson 9
Data Review
Students compute relative frequencies and proportions in two-way tables, e.g., entries shown as 12/50 = 0.24 (24%) and other fractions like 10/30 = 0.33. Students divide counts by totals to produce decimal/percentage representations and interpret those values (e.g., "12/50 = 0.24 of evening students prefer gaming"). Students also work with ratios in contexts of comparing counts across categories (sports, reading, gaming) when describing changes and popularity.
Lesson 10
Semester Exam
Students are given a verbal rate in problem 8 ("You earn $10 per hour. Write a function that represents your total earnings.") and the answer key shows y = 10x, so students translate a "per hour" rate into a function/unit-rate coefficient. In problem 35 students work with a tutor who charges "$18 per hour plus a $30 fee" and solve for hours given a total cost, applying the hourly rate in a contextual equation. Several slope and rate-of-change items (finding slope, writing linear functions) require students to interpret and use constant rates between quantities.