


Seventh Grade - MATH
5: Math
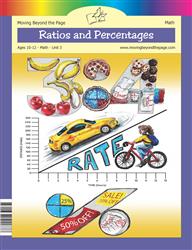
Unit 3: Ratios and Percentages
Lesson 3
Equivalent Ratios
Students make tables of equivalent ratios, plot ordered pairs on coordinate planes, and draw lines through the points (for example, (1,6), (3,18), (5,30) and the highlighted point (4,24)). The Parent Plan and activity instructions direct students to use the graph to solve ratio problems by identifying a given point on the line and using the coordinate information to find the answer. Answer keys explicitly highlight points on the graph (e.g., (4,24) and (40,16)) and show the plotted points and straight-line relationships.
Lesson 4
Unit Rates
Students compute unit rates (for example, converting 216 miles in 4 hours to 54 miles per 1 hour and dividing costs by quantity to find unit price). Students use tables, tape diagrams, double number lines, and are asked to create a graph from a table (Uri's hours vs. calories) and read values from it. The lesson asks students to interpret unit rates in context (miles per hour, calories per chip, dollars per ounce) and to use unit rates to solve further problems.
Lesson 8
Unit 3 Test
Students complete tables of equivalent ratios and plot coordinate pairs for proportional situations (for example, apples and pies with points (10,3), (20,6), (40,12)) and then use the graph to answer questions such as how many apples are needed for 24 pies and how many pies come from 30 apples. Students also complete other graphing and table tasks (models vs. hours) and practice finding unit rates and using rates from tables and diagrams. The Skills list explicitly includes "Make tables of equivalent ratios..., find missing values in the tables, and plot the pairs of values on the coordinate plane; use tables to compare ratios."
Unit 5: Algebraic Equations
Lesson 7
Independent and Dependent Variables
Students set up tables and graph proportional equations such as 5x = y and 10x = y and then read points from those graphs to answer context questions (for example, using the graph to find earnings for 6 hours or hours needed for a given amount). The lesson identifies unit rate language and shows unit-rate values in equations and tables (d = 45t; tables with (1,10) or (1,5) appear). Students also plot and interpret coordinate pairs from tables (e.g., (3,30), (1,10), (0,0) appear in examples) when solving word problems and using graphs to read situation-based values.
Lesson 8
Unit 5 Test
Students create tables of ordered pairs and graph linear equations (for example, they list and plot points (0, -8), (4, -4), (8, 0) for x - y = 8 and graph y = 2x + 1). Students rewrite equations, make tables, and identify points that are and are not solutions on coordinate grids. Students identify independent and dependent variables and write equations relating them in contextual problems (e.g., Ms. Crisp bulbs and Brandi/Tessa age problems).
Final Project
All About Me
Students are required to create at least one independent/dependent variable equation with a corresponding table and a written description of the relationship (explicitly: 'as x increases/decreases, y ______'). The lesson gives a proportional example 2x = y (piano twice as long as soccer) and asks students to solve for one variable given the other. Students are directed to include a tape/hanger diagram and a table for one equation and to check two-variable problems in the answer key by plugging values into the equation.
3: Math

Unit 1: Numbers
Lesson 1
Positive and Negative Rational Numbers
Students repeatedly work with rates given as "per hour" or "per week" (e.g., temperature drops 2.5 degrees per hour; submarine descends 4/5 mile per hour) and multiply rate × time to find total change. Students also compute unit rates by dividing a total change by time (e.g., −48 ÷ 6 = −8 °F per hour, −60 ÷ 5 = −12 per person), interpreting those quotients in context. Several activities ask students to create and explain real-world problems using these per-unit rates.
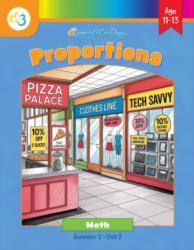
Unit 2: Proportions
Lesson 3
Constant Rate
The lesson repeatedly asks students to pick points on proportional graphs and compute k using k = y/x (Things to Know; Activity 3 instructs students to "find the value of k by picking a point on the line and using the formula k = y/x"). The materials state that the graph of a proportional relationship passes through the origin (0,0) and include graph problems where students decide whether a line is proportional because it begins at the origin. Real-world word problems (Activity 6) have students identify x and y in context (e.g., time and distance) and compute rates from specific point pairs such as 1 hour → 60 miles.
Lesson 4
Graphing Proportions
The lesson repeatedly identifies and explains the origin (0, 0) and the unit-rate point (1, k): a dedicated image and text describe (0,0) as zero of both quantities and (1,k) as the unit rate (example (1,10)). Multiple activities ask students to plot points from tables and equations (e.g., Jim's table with points (0,0),(1,12),(2,24) and y = 12x) and explicitly state that the unit rate is the y-value at x = 1. The Challenge and Skills Review items require students to name points that must appear on a proportional graph (e.g., (0,0), (1,65), (2,130)) and to explain the meaning of a point such as (1,5) in context.
Lesson 5
Proportional Relationship Equations
The lesson repeatedly asks students to interpret points on proportional graphs: Review Quiz Question 5 asks what the point (1, 5) on a proportional graph represents and Question 20 asks students to explain what the point (1, y) represents. The materials state that a proportional relationship "always makes a straight line through the origin" and include tasks requiring students to create graphs (e.g., theme park tickets) and describe proportionality. Several activity pages and answer keys explicitly identify (0,0) as the origin and identify the (1, r) point as the unit rate (e.g., answer key entries explaining (1,5) means unit rate = 5).
Lesson 7
Markups and Discounts
The lesson repeatedly has students multiply quantities by a percent or rate (e.g., Discount = Original Price × Discount Percentage; Markup = Cost Price × Markup Percentage) and works through numeric examples like 50 × 0.30 = 15 and 100 × 0.20 = 20. Students solve backward proportional equations in review problems (for example x × 1.20 = 72 → x = 72 ÷ 1.20) and use percent-change formula ((New − Original) ÷ Original) × 100. The Parent Plan explicitly states students will "use proportional relationships to solve multistep ratio and percent problems," and many activity pages give multi‑step percent/ratio problems for practice.
Lesson 9
Unit 2 Test
The Parent Plan and Introducing the Lesson explicitly state that students should "Explain what a point (x, y) on the graph of a proportional relationship means" and call out attention to (0,0) and (1, unit rate). Multiple student activity items directly ask students to interpret points: e.g., problems that ask "What does the point (0, 0) represent?" and "What does the point (1, 4) represent in a proportional graph where y is cost and x is number of items?" Answer keys supply expected explanations such as "The origin, meaning no items and no cost" and "$4 per item," showing students practice explaining those points in context.
Final Project
Lemonade Stand
Students are asked to create tables and graph proportional relationships (e.g., number of cups vs. tablespoons, number of lemons vs. total cost) and to label axes and plot lines. Students write equations in the form y = kx for the recipe scaling tasks and the answer key explicitly labels x as the independent variable (cups) and y as the dependent variable (tablespoons). The provided graphs show straight lines beginning at the origin (0,0) and plotted points (for example (16,32)), and students answer questions about steepness and how it relates to unit price.

Unit 3: Expressions
Lesson 4
Graphing Proportions
Students interpret points in context in multiple examples (e.g., earnings: (0,0), (1,10), (2,20) and walking: (3,6) meaning 3 hours → 6 miles). Activities explicitly ask students to explain whether a graph is proportional and to identify the unit rate, with directions to pick the point x = 1 or to divide y by x for any chosen point. The materials call out the origin (0,0) and the special role of (1,r) when finding the unit rate and include practice problems and answer keys that show (0,0) as meaning zero of both quantities and (1,r) as the unit rate r.
Lesson 5
More Graphing Proportions
The lesson repeatedly tells students to find the unit rate by looking at x = 1 (for example: "The unit rate is always the y-value when x = 1" and the Activity 1 example noting that when x = 1 the graph shows y = 3). Students are directed to start plots at (0,0) with contextual language (e.g., "Start with (0, 0) since no weeks means no money saved") and to plot and read points such as (1,3), (2,6), and (3,9). Multiple activities ask students to create tables, graph points, label lines y = mx, and interpret those points in context when comparing rates and slopes.
Lesson 6
Intercepts
The Parent Plan explicitly lists deriving y = mx for a line through the origin and y = mx + b for other lines, and multiple activities require students to set y = 0 and x = 0 to find x- and y-intercepts algebraically. Student pages and answer keys include examples and practice plotting intercepts, including a line whose intercepts are (0,0), and directions to plot lines from given x- and y-intercepts. Activities ask students to plot intercepts and connect them to form lines, reinforcing the connection between equations and their graphs.
Lesson 8
y = mx + b
The lesson explicitly presents y = mx as the proportional case (b = 0) and shows examples such as y = 2x that pass through the origin. Students graph real-world equations (e.g., y = 10x + 50) and are asked to identify and interpret the slope (rate) and the y-intercept (starting value). Activities ask students to derive equations from tables (find slope and b), plot points, and compare graphs, so students regularly connect numeric/table values to points on a graph.
Lesson 9
Unit 3 Test
Students repeatedly work with tables and graphs of proportional situations (e.g., babysitting, car rental, dog walker, lawn care) and are asked to determine if a relationship is proportional, find the slope (unit rate), identify the y-intercept, write the equation, and graph the data. Several items require plotting or identifying the origin (0,0) (e.g., plot (0,0) and (3,-6)) and at least one problem asks students to explain the y-intercept in a real context (membership joining fee). The parent/skills notes and problems also ask students to interpret unit rates and slopes from tables and graphs.
Final Project
Planes, Trains, and Automobiles
Students fill tables of time (hours) and distance (miles), plot those points on a Distance vs. Time graph, and write equations in the form y = mx for car, train, and plane. Questions ask students to identify rise/run (slope) for the train, determine which line is steepest, and ask whether each line represents a proportional relationship; the answer key states each line passes through the origin and that y = mx with m as speed. The parent/skills notes also state students should 'graph proportional relationships, interpreting the unit rate as the slope of the graph.'

Unit 5: Functions
Lesson 2
Linear and Nonlinear
Students work with tables and graphs to compute rate of change using the formula (y2−y1)/(x2−x1) and decide whether relationships are linear or nonlinear. The lesson includes an explicit proportional example (walking the dog: 100 steps each minute) and asks students to fill tables, compute y-values, and plot points from given equations. Student pages ask them to plot points and label graphs for linear equations (e.g., exercises asking to choose x values, compute y, and graph).
Lesson 3
Understanding Functions
Students are asked to start plotting Sylvia the Sloth's climb at (0, 0) and to mark her position each hour using given rates, so they plot and interpret coordinate pairs as (time, height). Several graphs are explicitly labeled with real-world axes (e.g., "Hours Worked" vs "Money Earned") and students match straight-line graphs that show a constant rate to scenarios like earning the same amount each hour. Multiple activities require students to calculate positions from a unit rate (e.g., 4 feet per hour) and then plot or describe the resulting linear segments.
Lesson 5
Slope
Students calculate slope from two points and from tables using the formula m = (y2 − y1)/(x2 − x1), with worked examples that interpret the result (e.g., "slope = 2 means every time x increases by 1, y increases by 2"). Students plot and use points such as (0,0), (2,1), and (4,2) on graphs to compute rise and run and see consistent ratios (e.g., rise 1 for run 2). Several activities ask students to pick rows from tables as points and then interpret the slope as how y changes when x changes.
Lesson 6
Slope-Intercept Form
Students work with contextual tables that label x as minutes and y as miles and are instructed to find slope and y-intercept from those tables (Table to Equation activity). In the Table to Equation example students compute m = 1/5 miles per minute, identify the y-intercept b = 0 (the origin), and interpret the slope as a unit rate (converted to 12 mph). Multiple activities ask students to identify the y-intercept by locating a point where x = 0 and to use slope to find how much y changes per 1 unit of x (Equation to Graph and Graph to Equation activities).
Lesson 7
Creating Functions
Students name inputs and outputs and write functions in the form output = slope × input + starting value (e.g., A = 6c + 12, P = 15h, cooking functions with b = 0). Students compute slope as the change in output per one unit of input and interpret that slope as the rate (e.g., "slope = 3 means $3 per hour"). Students identify and interpret the y-intercept by reading points like (0,5) or deducing (0,0) from a table and stating what that point means in context (starting cost or no pages read). Several activities present proportional cases (tables/graphs that pass through the origin and cooking examples where functions are y = m x) and have students find the slope and intercept from those representations.
Lesson 8
Comparing Functions
Students compute rates by dividing change in distance by change in time (Alex example) and find unit rates like 0.05 miles/min. Students find slope from a graph by using two points, explicitly using (0, 0) and (30, 2) to interpret the point (30, 2) as 30 minutes and 2 miles and to calculate the slope. Students identify starting points by reading y when x = 0 and use the y-intercept from equations (e.g., y = -3x + 100 gives a start of $100).
Lesson 9
Unit 5 Test
Students write and use linear functions for real situations (e.g., E = 12h, E = 15x) and find rates of change from tables (train and rental examples). Students identify and compute y-intercepts and starting values (e.g., "starting fee", y-intercept problems) and match distance-time graphs to story contexts, explaining how segments correspond to motion. Several items ask students to compare rates of change between functions and to interpret slope = 0, which connects slope/unit-rate interpretation to contextual situations.
Lesson 10
Final Project
Students create and analyze cards that require identifying slope and y-intercept from equations, graphs, tables, and real-world descriptions. Students construct linear functions, derive y = mx + b (including lines through the origin), and use graphs as sets of ordered pairs that link inputs to outputs. Students write equations from stories and tables and solve problems that emphasize rate of change and initial value.
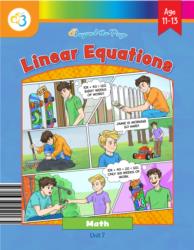
Unit 7: Linear Equations
Lesson 8
Linear Algebra In the Wild
Students write and solve linear equations in forms y = mx and y = mx + b (examples: y = 30x, y = 5x, y = 1.50x) and produce coordinate solutions for contextual problems (e.g., (5, 150) interpreted as 5 hours and $150; (30, 35) interpreted as Jake and Sophie's earnings). Activity pages prompt students to define variables, write equations, solve systems, and state conclusions as ordered pairs that link quantity (x) to total cost or value (y). Several worked examples and student tasks require students to interpret specific points on graphs as meaningful real-world pairs (number of items/hours and total cost).
Lesson 9
Unit 7 Test
Students solve word problems that produce proportional equations (for example, the lemonade problem: $2 per cup$ leading to total $38$) and they graph and analyze linear equations including lines that pass through the origin (e.g., an answer key shows Line A through (0,0) and (4,4) giving y = x). Multiple activities ask students to plot points, find slopes, and identify y-intercepts (for example, graph y = 2x − 1 and label the y-intercept). Students also work with many graphing tasks and coordinate grids where points are plotted and intersection points are interpreted as solutions.
Final Project
Getting Ready for College
Students write and graph linear cost equations that include lines through the origin (e.g., Dormitory: C = 1200m) and lines with nonzero intercepts (e.g., Apartment: C = 1500 + 1050m). Students analyze y-intercepts and slopes in context (Meal Plan: students identify the starting point and interpret it as a fixed cost; slopes are interpreted as cost per week or per mile in multiple activities). Students find and interpret intersection points (break-even points) and use those coordinates to make real-world decisions about which option is cheaper.

Unit 8: Data
Lesson 3
Constructing a Scatter Plot
Students regularly plot ordered pairs on scatterplots, label axes, choose scales, and answer questions about what individual points and trends mean (for example, predicting a test grade for someone who studied 8 hours). The lesson text explicitly interprets a plotted relationship by saying "each additional hour studied corresponds to approximately a 10% increase in test grade," which relates a one‑unit change in x to a change in y (a unit‑rate idea). Multiple activities ask students to interpret specific plotted values and make predictions from points on the graph.
Lesson 4
Linear Models
Students identify independent and dependent variables, find slope and y-intercept from scatterplots, and write equations in y = mx + b form (multiple activity pages ask students to write the equation and match equations to best-fit lines). Students interpret slope and intercept in words (for example, the ice‑cream example explains that m = 2 means 2 more cones per 1°F and b = 50 means 50 cones when x = 0). Students plot points from collected data, draw a best‑fit line, compute rate of change using two points, and use the equation to make numerical predictions (bird migration and many problem pages ask for predictions by substituting x values).
Lesson 6
Unit 8 Test
Students repeatedly create and interpret scatterplots, identify independent and dependent variables, and choose or write linear equations for data (several exercises ask whether relationships are linear and to write/choose equations such as y = 4x + 0). Students practice interpreting slope and intercept in context (the Parent Plan skills list explicitly includes using a linear model to interpret slope and intercept). Students also make predictions from graphs (e.g., predict mood for 12 hours of sleep or homework for 8 hours of gaming), which requires interpreting points on a graph as particular input-output pairs.
Final Project
Collecting and Organizing Data
Students are instructed to label axes, set up a graph, and plot each pair of numerical data values on a scatterplot (Step 1–3). The materials ask students to informally fit a straight line and analyze the scatterplot, answering "What do you notice?" and "What does that mean in your situation?" The Parent Plan skills list includes fitting straight lines, using a linear model, and interpreting slope and intercept.

Unit 9: Semester Exams
Lesson 2
Proportions Review
Students are asked to interpret specific points on proportional graphs: Activity 3 asks them to graph y = 6x, label points, circle the origin, and answer "What does the point (0, 0) represent?" and "What does the point (1, 6) represent?". Activity 2 and its answer key include prompts asking "What does the point (0,6) represent?" and give examples like (0,0) meaning zero notebooks cost zero dollars and (1,8) meaning one notebook costs $8. Several tasks (e.g., "Describe the Relationship", "Create & Graph", and real-world scenarios) require students to write equations, create tables/graphs, and explain in words what the graph represents in context.
Lesson 3
Expressions Review
Students work with proportional situations (babysitting and car rental) where tables include points like (0,0), (1,14), (2,28), and are asked to decide if the relationship is proportional, find the slope (unit rate), write equations (e.g., y = 14x), and graph the data. Activity 2 explicitly asks "What does the point (0, 0) represent?" and asks students to interpret whether a graph passes through the origin and what that indicates. Several tasks (e.g., tutoring service, delivery service, and other problems) ask students to identify the slope as a unit rate or to explain what the slope and y-intercept represent in context.
Lesson 5
Semester Exam
Students compute unit rates and constants of proportionality in multiple problems (e.g., problems 14, 15, 17, 18, 19, 34) and write equations for proportional relationships (e.g., y = (3/5)x, y = 4x). Students graph proportional lines (problem 20 and 37) and are asked to describe relationships; the answer key explicitly states that y = 4x passes through the origin (0,0) and that slope 4 means for every 1 unit increase in x, y increases by 4. Problem 17 and its key require students to recognize a table as proportional and find the constant of proportionality (5).
Lesson 6
Functions Review
Students calculate and interpret y-intercepts and x-intercepts in context (e.g., find the y-intercept of y = 3x + 4 and identify the starting cost in the taxi flat-fee + per-mile scenario). Students compute and interpret slope as a rate of change from points, equations, and real-world situations (e.g., write y = 18h for earnings and explain the slope 18 as dollars per hour; find slope from (2,1) and (6,9)). Students work with a table of points that includes (0,0), (1,5), (2,10) and are asked to find slopes and compare rates of change, which provides practice with relationships that go through the origin and with per-one-unit rates.
Lesson 10
Semester Exam
Students write a proportional equation in Problem 8 ("You earn $10 per hour. Write a function...") and the answer key gives y = 10x. Students find and record intercepts in Problems 3 and 4 (y-intercept (0,4) and x-intercept (4,0)). Students also graph linear equations (e.g., graph y = 2x − 4, graphing lines and plotting points) and compute slopes and points used on coordinate grids.