


Sixth Grade - MATH
5: Math

Unit 1: Operations
Lesson 2
Multiplication Review
Students are introduced to variables as "letters used to represent an unknown number" and are asked to write multiplication with a variable (e.g., "What are the four ways to represent the multiplication problem '4 times n'?" and answers showing 4n, 4(n), 4 · n, 4 × n). Students solve multiple real-world multiplicative word problems (e.g., cost of uniforms: 12 × 24, earnings per week × weeks, Kayla's $5.25 per hour × 100 hours) that involve two quantities related multiplicatively. The lesson connects multiplication structure to distributive and associative properties, which students use to rewrite and compute related numeric products (e.g., rewrite 36 × 27 to find 36 × 2.7, 360 × 27, etc.).
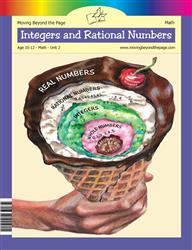
Unit 2: Integers and Rational Numbers
Lesson 6
The Coordinate Plane
Students plot and label ordered pairs on coordinate grids in multiple activities (Activity 1 foldable, Day 2 practice points, and the "Points in the Coordinate Plane" sheets). Students trace real-world routes on a city-map grid and record movements as ordered pairs (Deon's map: west/east and north/south moves). Students move points by a specified number of units (e.g., move A left 5 and down 3) and plot the resulting coordinates, and they graph reflections across axes.
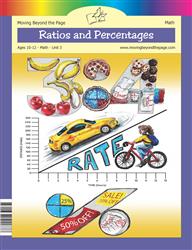
Unit 3: Ratios and Percentages
Lesson 3
Equivalent Ratios
Students make tables of equivalent ratios, plot ordered pairs on coordinate grids, and draw lines through the points (Activity 3: Leo and Kara, and other table/graph problems). Students analyze proportional relationships from tables and graphs to find missing values (e.g., fill the table, plot (4,24) from (1,6),(3,18),(5,30) and use the graph to answer how many lemons for 4 pitchers). Students also set up and solve equations with a variable to represent group size in at least one example (Sam and Lindy: 4x + 3x = 91) and solve for the quantities.
Lesson 4
Unit Rates
Students compute unit rates in real-world contexts by dividing totals to find amounts per one unit (e.g., Elena: 216 miles in 4 hours → 54 miles/hour; Jalen: 156 calories in 12 chips → 13 calories/chip; multiple unit price examples $5.25/3 = $1.75 per quart). Students apply the unit rate to find dependent quantities by multiplying the unit rate by a given number of units (e.g., find calories for 25 chips, miles for 5 hours, cost for 10 pounds). A quiz item (Uri) gives a table of hours vs. calories and asks students to create a graph and answer questions from the table/graph, so students practice reading and plotting a rate from a table and graph.
Lesson 6
Percentage Problems
Students translate percentage word problems into number sentences and write equations such as part = percent × whole (e.g., 32 = 0.64x) to solve for unknowns. The answer key and activities use a variable (n or x) to represent the unknown quantity in real-world contexts (discounts, tax, test scores) and students solve for that variable. Students also practice ratio reasoning with double number line diagrams and equivalent ratios to relate parts and wholes.
Lesson 8
Unit 3 Test
Students complete tables and plot ordered pairs on coordinate grids (e.g., apples vs. pies: (10,3), (20,6), (40,12)) and answer questions that analyze those tables and graphs. Students make tables of equivalent ratios and use tape diagrams and double number lines to solve proportional problems (e.g., Tomás builds models in hours; Marco and Stanley car totals). Students compute unit rates and steady-rate problems (e.g., Braden's miles per hour, candy pieces per minute) and set up simple number-sentence variables for percentage problems (e.g., n = 28% × 200).
Final Project
What's the Best Buy?
Students collect price and quantity data in organized tables and calculate unit prices by setting up ratios and dividing total price by number of units (Activity 2 and Activity 3). The project includes a constant-speed style problem (Activity 5, Question 2: steady speed of 1 mile every 6 minutes) and a savings task that requires filling a table and plotting savings over 1, 6, and 12 months (Activity 5, Question 5). The Skills list explicitly names recognizing and representing proportional relationships, solving unit-rate problems (including constant speed), and using ratio language.
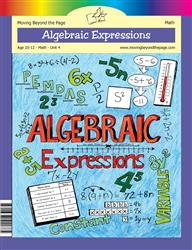
Unit 4: Algebraic Expressions
Lesson 1
Introduction to Algebra
Students represent changing quantities with variables and write expressions and simple equations in real-world contexts (examples include pay: 5n, practice time: 20n, area: A = s^2, and statements written as 20 + n = 35 or a + 3 = 8). Students evaluate those expressions for specific values (e.g., 20n evaluated for n = 2 or n = 10) and use word problems to translate situations into algebraic expressions. The lesson repeatedly asks students to identify constants and variables and to write algebraic expressions from verbal descriptions.
Lesson 3
Working With Expressions
Students translate real-world situations into algebraic expressions (e.g., Milo: 6 + n; Jade: n - 8; Yuji: 2n + 10; Damien: 12 + n). Students write expressions that represent one quantity in terms of another (e.g., Laura eats p + 2 slices where p is her brother's slices; Matt's pay is written as 5 + 4y; Josie's earnings are written as 3n). Students evaluate expressions for different numerical values and complete a table that shows outputs for given inputs (the chart evaluating 5 + n, 8x - 6, p ÷ 2, and 3(n + 1) at n = 4, 9, 12).
Lesson 5
Equivalent Expressions
Students write expressions that use variables to represent quantities and combine them, for example forming 12b + 9b + 5p + 3p + 8g + 10g and simplifying it to 21b + 8p + 18g in the candy problem. Students repeatedly practice representing quantities with variables and manipulating those expressions (e.g., n + 5n = 6n, x + x + 2 + 2 = 2x + 4) across multiple activities. One Basic Skills Review problem has students find a unit rate (push-ups per minute) and use that rate to find the number of push-ups for a longer time interval, which involves a changing quantity related to time.
Lesson 6
The Distributive Property
Students translate real-world situations into algebraic expressions (e.g., Tessa's purchase 2n + 3n simplified to 5n and evaluated for n = 4). Students write area expressions with a variable (the playground area shown as 5(n + 2) and expanded to 5n + 10) and create expressions from multiple word problems (e.g., Raoul's earnings, Nick's running, Penny's cupcakes). Students also choose numeric values for variables and evaluate expressions to compare or prove equivalence (several activities direct students to substitute numbers and compute results).
Lesson 7
Unit 4 Test
Students translate real-world situations into algebraic expressions and choose expressions that represent one quantity in terms of another (e.g., Zane: 12n + 5 for earnings per n hours; Jeremiah: 5x + 3 for earnings per x dogs). Students write equivalent expressions using properties (e.g., 12(x + 6) and 12x + 72 for Alana) and identify the variable, coefficient, and constant in contextual problems (e.g., identify n as the variable in 15 + 9n). Several word problems ask students to write and evaluate expressions for outcomes based on a varying quantity (e.g., n + 7, n - 12).
Unit 5: Algebraic Equations
Lesson 1
Algebraic Equations
Students translate word sentences into algebraic equations and use variables to represent unknown quantities in real-world contexts. Students write and solve equations from word problems such as 3x = 24 (notebooks), m/6 = 20 (marbles), 36 - 4n = 12 (muffins), and 70 = n + 29 (sandwiches), and practice substituting values to check solutions. Student activity pages require composing equations from scenario information and selecting values that make the equations true.
Lesson 2
Solving One-Step Equations, Part 1
Students represent unknown quantities with variables in multiple real-world word problems (e.g., Kali and Lina cookie sales: n + 60 = 100; Everett money: 16 + n = 72). Students write and solve equations from those problems and check solutions by substitution (activity pages and answer keys show equations and solutions). The lesson also presents equations with two related quantities (challenge: n + 4 = 2n + 2; example: 2x + 4 = x + 6) and asks students to form equations that connect the unknown to other information.
Lesson 3
Solving One-Step Equations, Part 2
Students represent unknown quantities with variables in multiple real-world word problems (e.g., Antonia's plant: 5n = 40; Alex washing cars: 12y = 96; Harper canoeing: 2n = 12). Students write one-step equations that connect two quantities (grouping or part-whole relationships) and solve for the unknown using inverse operations, then check solutions by substitution. Students also create and use tape and hanger diagrams to show how one quantity relates to another in grouping or partitioning contexts.
Lesson 4
Solving Two-Step Equations
The lesson text explicitly includes a "Lesson 6: Independent and Dependent Variables" section that tells students to "use variables to represent two quantities in a real-world problem," to "read the scenarios, write the equations, identify the dependent and independent variables, set up a table that shows possible answers," and to use examples related to motion, speed, money and work. The two-step equation activities require students to write equations from word problems (e.g., 3n + 4 = 19), identify the unknown, and solve and check solutions, and the materials provide guidance for creating tables/charts for some activities. The materials also have students practice creating tape/hanger diagrams and translating word problems into algebraic equations, which has students represent relationships between quantities with variables.
Lesson 6
Solving Inequalities
Students write and solve inequalities that model real situations (for example, 5n ≤ 75 for Gabriel's earnings, <n + 4 < 16 for Missy's movie trips, and 3n - 5 ≥ 22 for Farmer Joe's chickens). Students use variables to represent quantities in word problems (n for weekly earnings, n for number of shirts/chickens, etc.), manipulate expressions to isolate the variable, and graph solution sets on number lines. Activity pages and answer keys show students forming an algebraic relation from a context and solving it.
Lesson 7
Independent and Dependent Variables
Students translate real-world situations into two-variable equations (examples: d = 45t for driving, y = 15x for cookies, y = x - 2 for ages, 10x = y and 5x = y for pay and biking). Students practice isolating the dependent variable using inverse operations (e.g., rewriting 2x - y = 4 as y = 2x - 4) and then create input/output tables listing ordered pairs (images and tables for 2x - 4 = y, y = x + 2, 2x + 1 = y, etc.). Students plot those ordered pairs on coordinate grids, draw lines through the points, and read or use the graphs and tables to answer contextual questions (e.g., how much Kevin earns for a given number of hours, how many hours for a given paycheck).
Lesson 8
Unit 5 Test
Students are asked to identify independent and dependent variables and write equations in word problems (Ms. Crisp bulbs; Brandi and Tessa ages). Students rewrite equations, create tables of (x,y) pairs, and graph solution lines (x − y = 8 activity; y = 2x + 1 activity with table and plotted line). Several word problems require using variables to represent two related quantities and solving for one in terms of the other (e.g., x − 6 = y, x − 8 = y) and the practice pages ask students to list ordered pairs and identify points that are/are not solutions.
Final Project
All About Me
Students are required to create at least one equation that contains two variables and to indicate which is independent and which is dependent (e.g., the checklist and planning note: "1 independent/dependent variable equation with a corresponding table, and description of the relationship (as x increases/decreases, y ______)"). The materials give a concrete two-variable example (2x = y) and ask students to answer a question using that equation (if piano practice y = 4, find soccer practice x). The project asks students to produce a corresponding table and a description of how y changes as x increases or decreases.
Unit 6: 2D Geometry
Lesson 4
Area
Students set up and solve simple algebraic equations to find missing measurements (for example, Omar's parallelogram: 15 · n = 75 to find the height). Students also write an equation to represent a quantity in a context (the paver problem uses 24n = 4320 to represent how many pavers fit the walkway). Students use a coordinate grid to count units and find base and height when decomposing a kite, connecting grid coordinates to numerical measures used in area calculations.
Lesson 5
Circles
Students measure real circles and record circumference and diameter values in a table, then compute the quotient c/d to observe the constant pi. The lesson uses variables and formulas (C, d, r, π) and derives/writes equations such as C = πd, C = 2πr, and d = 2r. Students apply these equations to solve real-world problems (e.g., pool perimeter, rubber seal, tablecloth) using measured or given diameters/radii.
Lesson 6
Scale Drawings
Students set up and solve proportions using variables (for example, 1 inch/5 feet = 6 inches/n feet and 1/3 = x/18) to find unknown actual or drawing measurements. Students complete tables comparing original and scale drawing measurements (length, height, perimeter, area) and create coordinate-plane drawings of original, enlarged, and reduced rectangles. Student pages and activities ask students to compute scale factors as ratios and percentages and to use those ratios to calculate corresponding linear measures.
Lesson 7
Unit 6 Test
Students write and solve equations with variables to find unknown angle measures (e.g., n + 2n + (3n + 12) = 180; 3n = 2n + 35; 3n + 35 = 4n) and substitute values to compute measures. Students work with scale-factor problems that relate two measurements (e.g., find a reduction scale of 1/3, find enlargement factor 5:1) and compute related perimeters and areas. Several word problems require using formulas and numeric relationships between geometric quantities (e.g., diameter/radius to compute circumference and area).
Unit 7: 3D Geometry
Lesson 1
Three-Dimensional Solids
Students are introduced to Euler's formula using letters F, V, and E to represent faces, vertices, and edges and are shown the equation F + V - E = 2. Students write an equation with a letter for an unknown (F + 5 - 8 = 2) and perform algebraic steps to isolate the variable (combine like terms and add inverse to find F = 5).
Lesson 3
Volume
Students use variables and formulas such as V = l × w × h, V = B × h, and V = s^3 to represent volume in terms of length, width, height, base area, and side length. Students apply those formulas to real-world contexts (boxes, sugar cubes, craft cubes, aquariums, mailing boxes) by substituting numerical and fractional measurements for the variables and computing volumes. The lesson has tasks where students convert mixed numbers to improper fractions and multiply those variable expressions to find numeric volumes.
Lesson 5
Problem Solving With Solids
Students are asked to use a variable to represent a missing dimension and set up algebraic equations (e.g., 54 = L × 4 1/2 × 2) and then solve for the variable. Students write and solve equations in real-world contexts (e.g., 5n + 10 = 130 for Lucas's mowing fee) and repeatedly use formulas (V = lwh, SA = 6s^2) with a variable for unknown measures. The Parent Plan and activity directions explicitly prompt students to write an algebraic equation using a geometric formula and a variable for the missing dimension.
Lesson 6
Unit 7 Test
Students use and manipulate formulas that include variables such as V = B × h and V = l × w × h in real problems (e.g., Bella's flute: 182 = 6.5 × h; the soap factory: 6300 = 42 × h). Several problems require solving for a missing measure by isolating a variable (finding height or length from a volume equation). The unit review and answer key list and use these symbolic formulas directly.

Unit 8: Statistics
Lesson 2
Populations and Samples
Students evaluate algebraic expressions (for example, finding the value of 4n + 12 when n = 5) and solve simple equations in context (for example, writing and solving n + 26 = 102 to find Rico's brother's score). Students compute quantities given a rate (for example, using 85 pieces per minute to find total pieces in 12 minutes), which implicitly involves two related quantities (rate and time). Students also solve and graph simple inequalities and perform routine symbolic manipulations in the Basic Skills Review.
Unit 9: Skills Review
Lesson 3
Expressions, Equations, and Percentages
Students write variables and expressions for real-world contexts: they write Marie's earnings as 9n + 3 and evaluate it for n = 7. Students translate word problems into equations and solve them (e.g., Naomi: 5n + 3 = 18 solved for n). The activity directions explicitly ask students to 'write an equation for each word problem and then solve,' and the skills list includes 'Use variables to represent numbers and write expressions when solving a real-world or mathematical problem.'
3: Math

Unit 1: Numbers
Lesson 2
Fractions and Decimals
Students are asked to set a variable x equal to a repeating decimal and use algebraic steps to convert it to a fraction (examples show 10x = 3.3 and 100x = 17.17, then subtracting and solving for x). The student activity pages and worked examples explicitly guide students through writing and solving these equations to find fraction equivalents for repeating decimals like 0.̅3 and 0.̅17.
Lesson 7
Arctic Marine Research
Students are given population models that use variables, for example N = 2^t where t is the number of 20-minute intervals, and they are asked to calculate the population after specified intervals. Students compute values for these formulas (e.g., population after 6 intervals and after 10 cycles) and compare growth modeled by 2^t versus 3^t. The lesson also asks students to perform exponential calculations for DNA replication starting from one strand, reinforcing the use of a variable to represent a changing quantity over time.
Final Project
Mars Station Test Mission
Students are given and use the formula A = πr^2 to calculate drop zone radius from a provided area and then compute total cost, showing an explicit equation relating area and radius. Students complete tables that relate numerical quantities (e.g., temperature difference to heater energy per hour/day/year; sunlight and wind inputs to solar/wind outputs; energy shortfall to number of fuel cells and storage area). Answer-key tables show students computing dependent quantities (energy outputs, fuel cells needed, total costs) from given independent inputs for each location.
Unit 2: Proportions
Lesson 1
Proportional Relationships
Students set up labeled fractions and use variables (x, n) to represent unknown quantities in multiple real-world problems (e.g., beads: 3 blue/2 red = x blue/12 red; Lexi: 2 books/3 days = 24 books/n days). Students solve those proportions using multiplication/division and cross-multiplication methods and complete word problems about travel, cost, and scaling (e.g., car distance, tickets, paint coverage). The materials repeatedly require students to write equations as proportions and solve for the dependent unknown in context.
Lesson 2
Unit Rates
Students set up and solve proportions using a variable (for example 2/4 = n/10 leading to 2×10 = 4n) to find unknown quantities in real-world contexts. Students use formulas written in words (e.g., Folding Rate = (Total Sheets Folded) ÷ (Total Time in Seconds)) and compute unit rates in many contexts (e.g., 300 miles ÷ 5 hours = 60 miles per hour; $84 ÷ 7 hours = $12 per hour). Several word-problem activities require students to find unit rates and then scale them (for example multiplying a unit rate by 60 seconds to predict folds per minute).
Lesson 3
Constant Rate
Students identify independent and dependent variables in real-world contexts (Activity 1) by labeling quantities like time as x and distance or money as y. Students work with tables of ordered pairs (Activity 2) and compute k = y/x to decide if relationships are proportional. Students pick points on graphs (Activity 3), verify lines pass through the origin, and compute k from graph coordinates to relate the graph to the equation y = kx. Students set up and solve real-world problems (Activity 6, Build Your Own Problems, Optional Extension) by writing equations that express the dependent quantity in terms of the independent one and substituting values.
Lesson 4
Graphing Proportions
Students identify independent and dependent quantities in real-world contexts (e.g., Jim's dog-walking: independent = hours, dependent = money) and label axes accordingly. They write equations of the form y = kx from tables and scenarios (e.g., y = 12x for Jim, y = 4x example, y = 80x or d = 65t in the challenge). Students build tables from equations, plot ordered pairs (0,0), (1,k), (2,2k), etc., and analyze graphs and tables to determine unit rates, check proportionality, and compare steepness of lines.
Lesson 5
Proportional Relationship Equations
Students define variables for two quantities and write equations to relate them (e.g., t = pn, t = 12n, t = 15n, t = cm, a = rh). Students complete and analyze tables of values (movie ticket, pizza, apples, calories, painting, driving, factory production) to test whether the ratio remains constant and to fill missing table entries. Students interpret and create graphical relationships in several tasks (theme park graphing challenge, review quiz graph interpretation, and statements that proportional graphs are straight lines through the origin) and relate unit rates to equations.
Lesson 6
Taxes, Tips, and Commissions
Students are asked to let variables represent unknowns and write equations in multiple examples (e.g., 0.012 × V = $2,400 to find a home's value, 0.20 × I = $9,000 to find income, and 1.08x = $212 to find a pre-tax price). The activities and answer keys explicitly show formulas using variables (Commission = Sales × Commission Rate; Gratuity = Tip Percentage × Original Bill) and include work-back problems that require solving those equations for the unknown variable. Student activity pages prompt students to set up and solve these equations in forward and backward word problems.
Lesson 7
Markups and Discounts
Students solve contextual percent and backward problems that use unknowns, for example the backward problems asking "What was the original cost price?" and answer-key work that sets up equations like x × 1.20 = 72 and x × 0.60 = 18. The lesson presents formulas written as relationships between quantities (Discount = Original Price × Discount Percentage; Final Price = Original Price − Discount; Selling Price = Cost Price + Markup), which students use to compute one quantity from another. Several activity pages and the answer key show students performing algebraic manipulations to find an unknown price (solving for x).
Lesson 8
Simple Interest and Percent Error
Students use and manipulate the symbolic formula I = Prt throughout the activities, filling in blanks on the Student Activity Page and calculating interest and balances (e.g., I = 600 × 0.04 × 5, Balance = P + I). Students solve for missing quantities (rate, time, principal) by rearranging the equation (examples include solving 250 = 2500 × r × 2 and 108 = 600 × 0.06 × t). The materials repeatedly have students represent monetary quantities with variables P, r, t and compute numeric outcomes from those equations.
Lesson 9
Unit 2 Test
Students practice representing relationships with variables and equations throughout the activities (e.g., write y = (3/5)x, y = 4x, y = 7x, and y = (2/7)x). Students analyze tables and graphs to decide proportionality and find the constant of proportionality (multiple table problems ask to circle whether pairs are proportional and to find k). Students interpret graphs and points in context (questions ask what (0,0) and (1, r) or (1,4) mean, and students analyze an Hours Worked vs. Money Earned graph with labeled axes and plotted points).
Final Project
Lemonade Stand
Students create tables of values (e.g., cups vs. tablespoons, number of lemons vs. total cost) and fill in ordered pairs for multiple input values. Students plot those ordered pairs on graphs with labeled axes and draw lines for each relationship, then compare steepness to interpret unit rates. Students write equations in the form y = kx (answer key shows y = 2x and y = 1.5x) and are prompted to identify x as the independent variable and y as the dependent variable.

Unit 3: Expressions
Lesson 2
Rewriting Expressions
Students set up and use variables in multiple real-world contexts (e.g., Total Cost = 25 + 3r with r defined as number of rides; Selling Price = Wholesale Price × (1 + Markup Rate); 31.50 = P(1 + 0.05) to solve for original price). The activities require plugging known values into equations, rearranging to solve for an unknown (e.g., 54 = P × 0.9 then P = 60; 48.75 = 65(1 − D) solved to find D = 0.25), and writing equations that express one quantity in terms of another.
Lesson 3
Algebraic Expressions
Students define variables and write equations for real-world situations (e.g., t = cp + s for the markers problem and s = r(m + t) for the Ferris wheel rides). Students set up and solve perimeter equations using variables (e.g., 54 = 2(l + 6) and solving for l = 21) and solve equations of the form ax + b = c and a(x + b) = c in multiple activities. Multiple activity pages require students to translate word problems into algebraic equations and solve for unknowns (markers, rides, perimeter, and cost problems).
Lesson 4
Graphing Proportions
Students represent two quantities with variables in multiple real-world contexts (hours worked → x and earnings → y; time → x and distance → y) and are directed to plot ordered pairs such as (0,0), (1,3), (2,6) from equations like y = 3x. Students make tables from equations (Activity 3), plot those table values on coordinate grids, and connect the points to form lines. Students analyze graphs to determine proportionality and unit rate (divide y by x) and write equations in the form y = kx from graphs (Activity 4) and from real data (e.g., 120 miles in 3 hours → 40 mph).
Lesson 5
More Graphing Proportions
Students write equations in the form y = mx for real-world contexts (e.g., y = 4x for walking, y = 2x or y = 3x for recipes, y = 0.6x for a faucet) and are asked to create corresponding tables of values. Students plot ordered pairs from those tables and from equations (e.g., (1,4),(2,8),(3,12)), draw straight-line graphs through the origin, and compare the steepness of lines to determine which rate is greater. Students calculate unit rates by dividing y by x from tables and identify the slope m in equations and graphs, then interpret those rates in context (miles per hour, dollars per month, cups per milk).
Lesson 8
y = mx + b
Students translate real-world situations into y = mx + b (Activity 8: Liam's earnings y = 10x + 50; multiple marketplace and service scenarios ask students to write equations from context). Students extract equations from tables (Activity 7: find m from change in y/change in x, solve for b, then write and graph the equation) and from pairs of points (Activity 6: compute slope from two points, substitute into y = mx + b to solve for b). Students convert standard-form equations to slope-intercept form and graph them (Activity 4), and repeatedly compare equations, tables, and graphs across activities.
Lesson 9
Unit 3 Test
Students work with multiple real-world tables (e.g., babysitting hours and earnings; car rental days and cost; dog walker and lawn care tables) and are asked to determine proportionality, find slope and y-intercept, write equations (e.g., y = 10x, 30 + 10x = 80), and graph the data. Several problems require writing equations from scenarios with a per-unit rate plus a fixed fee (e.g., $30 + $10x = 80, gym membership $40/month + $35 joining fee) and solving for the unknown. Tasks ask students to compare rates of change from graphs and tables (e.g., which line has greater rate of change) and to identify whether relationships are proportional by checking if the graph passes through the origin.
Final Project
Planes, Trains, and Automobiles
Students fill a table of time (hours) and distance for car, train, and plane (time rows 0–4) and use those values to plot distance vs. time. Students are explicitly asked to write equations in the form y = mx for motion (y = distance, x = time) and to graph all three lines, answer questions about rise/run, which is fastest/slowest, and whether the lines are linear or proportional. In the cost activity, students write cost equations in the form y = mx + b, complete a table of costs at distances 0, 300, and 500 miles, graph the cost lines, and solve for a break-even distance by setting two equations equal.

Unit 4: Probability
Lesson 2
Observing Probability
Students record spinner outcomes in tables (tallies and totals) for multiple trial sets (10, 50, 100) and convert those totals into experimental probabilities as fraction, decimal, and percent. They use the formula Experimental Probability = Number of times it happened / Total number of spins and compute predictions using Prediction = Experimental Probability × 600 to produce predicted counts out of 600. The student activity pages provide structured tables for recording results and columns for calculated experimental probabilities and predicted spins.
Lesson 3
Probability Models
Students compute predictions by multiplying a probability by the number of trials (e.g., 1/6 × 30 = 5, 1/6 × 120 = 20) in the Roll of the Dice and Making Predictions activities. Students record experimental results in tally tables and activity pages (Rounds 1–3, Non-Uniform Events, Probability Models) and calculate relative frequencies (count/total) to compare to theoretical probabilities. The Fine Arts and other real-world examples ask students to build a probability model from counts (e.g., 16 choir, 10 band, 8 orchestra) and use that model to answer questions and make predictions.

Unit 5: Functions
Lesson 1
What Is a Function?
Students represent relationships with variables (x and y) and write equations from worded rules (Activity 2: write y = 2x + 3, y = x^2 + 5, etc.). Students compute outputs for chosen inputs and complete input/output tables, then plot those ordered pairs on coordinate grids (Activities 3 and 4). Students match tables to graphs and compare linear and nonlinear cases, and they use the Vertical Line Test and discussion prompts to connect graphs, tables, and equations.
Lesson 2
Linear and Nonlinear
Students plug given equations (for example y = 2x + 4, y = x^2, y = x + 1, y = x - 4, y = 2x + 3) into tables, compute y-values from x-values, and fill tables to find rates of change. Students plot ordered pairs from those tables on coordinate planes and interpret whether the plotted points form a straight line or a curve. Students compare the tabled rate-of-change and the shape of the graph to the provided equation to decide whether a relationship is linear or nonlinear.
Lesson 3
Understanding Functions
Students interpret and describe graphs by identifying when a quantity is increasing, decreasing, or constant and whether a graph is linear or nonlinear (Graph Matching and Describing Graphs activities). Students compute and plot positions over time from verbal rate descriptions (e.g., Sylvia the Sloth: start at (0,0), mark positions each hour using 4 ft/hr, then flat, then 5 ft/hr) and connect the dots on coordinate axes. Student pages for the turtle and hot-air balloon similarly require students to translate step-by-step verbal descriptions into plotted points and continuous graphs.
Lesson 4
Intercepts
Students find x- and y-intercepts from graphs by identifying where the line crosses the axes and record coordinates (Activity 1 and practice graphs). Students identify intercepts from tables by locating rows with x = 0 or y = 0 and use tables to determine intercept points (Activity 2). Students set x = 0 and y = 0 to find intercepts from equations given in standard and slope-intercept form (e.g., 2y + 3x = 4 and y = 2x + 3) and work problems that include equations like y = -3x + 6. Students also interpret intercepts in real-world contexts (prepaid card/movie tickets and water consumed vs. miles walked) and explain what the intercepts represent in those scenarios.
Lesson 5
Slope
Students practice calculating slope from graphs and from two ordered pairs using the slope formula m = (y2 − y1)/(x2 − x1), and they apply this same process to values taken from tables. Students rewrite and solve equations to put them into y = mx + b form and identify the slope (m) and y-intercept (b) from those equations. Students also analyze whether slopes are positive, negative, zero, or undefined by reading graphs and tables and by matching those representations to the equation form.
Lesson 6
Slope-Intercept Form
Students work with a real-world subway context where x is minutes and y is miles and they are instructed to pick points from tables and graphs (Table to Equation and Graph to Equation activities). They calculate slopes using m = (y2 - y1)/(x2 - x1), find y-intercepts (look for y when x = 0), and write equations in the form y = mx + b. Students graph equations from tables and from y = mx + b (Equation to Graph) and interpret slope as a rate (e.g., miles per minute, converted to miles per hour).
Lesson 7
Creating Functions
Students define variables for real-world quantities and write equations in the form output = slope × input + starting value (e.g., A = 6c + 12 for chores and savings). They extract rate of change and starting value from word problems, tables (e.g., hours vs. pages read giving P = 15h), and graphs (e.g., reading points and bike rental graph leading to C = 3h + 5). Activities ask students to find slope via the slope formula, identify y-intercepts from tables/graphs, and convert those representations into function rules across multiple examples and practice pages.
Lesson 8
Comparing Functions
Students are given and work with explicit equations written in the form y = mx + b (e.g., y = -3x + 100, H = 4x + 10, d = t + 4, d = 3t + 2, y = -10x + 50) and the lesson labels the variables (x is time, y is amount). Students calculate rate of change from tables and graphs (finding slopes using two points, converting dates to numeric x-values, and computing m = Δy/Δx) and identify starting values by evaluating y when x = 0 or by reading y-intercepts. Multiple activities require students to compare rates and starting points across graphs, tables, equations, and verbal descriptions, relating the numerical slopes and intercepts to the different representations.
Lesson 9
Unit 5 Test
Students write equations from real-world contexts using variables (e.g., E = 12h, E = 15h, y = 2x + 17, y = 15x + 25, y = 4x - 3). Students construct and use tables and graphs to analyze linear relationships (e.g., a train time-distance table to find rate of change, streaming subscription cost graphs to compare starting fees and rates, and distance-vs-time graphs to match a travel story). Students convert between representations and identify slope and intercepts (e.g., graphing y = 3x - 1, completing function tables from a rule, and finding slopes from plotted lines).
Lesson 10
Final Project
Students create yellow cards that ask them to write equations from real-world descriptions (examples include Emma earning $10 per hour and a car driving steadily at 60 mph where students write the equation and identify slope). Students create green table cards that require them to draw tables of x- and y-values, identify slope from a table, complete missing values, and "write an equation for the table." Students create red graph cards and blue equation cards that ask them to identify slope and y-intercept, decide if a graph or equation represents a function, and match graphs, tables, and stories to equations.
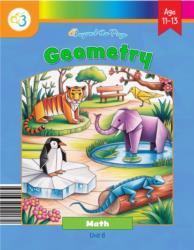
Unit 6: Geometry
Lesson 1
Congruence and Similarity
Students set up and solve for unknowns using a variable x in multiple places (for example, the Similar Shapes Notes use 6 ÷ 3 = 2 and then x = 10 ÷ 2 = 5). Activity prompts ask students to find scale factors and compute missing side lengths using equations like 5 × (scale factor) = ? or x = larger ÷ scale factor. Students also write proportional relationships between corresponding sides when comparing similar shapes.
Lesson 2
Translations
Students learn and use the algebraic translation rule Ta,b → (x + a, y + b) and apply it to move points and shapes by computing new coordinates (for example, M(6,-2) → M'(1,1) and X(0,0) → X'(-4,1)). Students plot original and translated points on coordinate grids, record start and end coordinates, and complete activities that require finding translated coordinates and writing translation rules from given ordered pairs. The materials include an explicit notes page and practice problems where students compute and write the new (x', y') coordinates in terms of x, y, a, and b.
Lesson 6
Dilations
Students compute new coordinates by applying the rule (x, y) → (x × scale factor, y × scale factor) and check dilation by comparing ratios of new to original x- and y-coordinates in tables. Students use the equation new length = original length × scale factor to calculate new side lengths and they solve for unknowns (e.g., x = 8 × 2.5 or k = new ÷ original). Students plot original and dilated points on coordinate grids and use those graphs and tables of coordinate pairs to verify the multiplicative relationship.
Lesson 9
Using the Pythagorean Theorem
Students use variables a, b, and c and the equation a² + b² = c² throughout the lesson to represent side lengths and solve for unknown sides. Students set up and solve equations for missing sides in real-world contexts (ladder, flagpole, city blocks) and on coordinate grids to compute distances. Students rearrange the Pythagorean equation to isolate a variable (e.g., solving a² = c² − b² and taking square roots) in multiple examples and practice problems.
Lesson 10
Volume
Students use variable notation (V, r, h) and write equations such as V = πr²h, V = (1/3)πr²h, and V = (4/3)πr³ to represent volume in real-world contexts (e.g., cans, cones, balls). Students plug known quantities into these equations, perform algebraic steps, and solve for a dependent quantity when another is given (examples show solving 314 = 3.14×25×h to find h = 4). Students apply these equations to real objects and practice working backward to find missing measurements like height or radius.
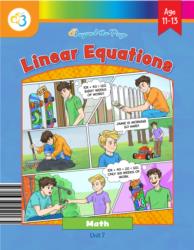
Unit 7: Linear Equations
Lesson 2
Multi-Step Equations
Students set up and solve equations from multiple real-world contexts (e.g., Mr. Patel grocery example: 12 + 15 + 3c = 45; catering cost: 50 + 8.75g = 312.50; running track: 1.5d = 36). Directions repeatedly prompt students to "define your variable" and translate word problems into equations (Activity 4, Advanced Real-World Equations, and many practice pages). Several problems represent one quantity as a constant plus a rate times a variable (cost = fee + rate×quantity), so students practice expressing a quantity in terms of another.
Lesson 4
Multi-Step Word Problems
Students define a variable and translate real-world situations into equations in multiple examples (e.g., gym membership 25 + 15x = 130 and Netflix 18x + 20 = 146) and then solve for the unknown. Students set two expressions equal to find when two quantities match in problems like the phone plans (25 + 7x = 10 + 8x) and the comic-strip comparing costs, showing they represent changing quantities with a variable. The activities require students to write, manipulate, and check equations from word problems and to find values (e.g., months, miles, GB) that satisfy real-world conditions.
Lesson 5
Intersection and Graphing
Students graph linear equations in slope-intercept form (y = mx + b) and plot points such as (0,3), (1,5), and (2,7) to draw lines. They convert equations into slope-intercept form and compare slopes and intercepts to decide whether systems have one, none, or infinitely many solutions. Students identify intersection points as coordinate-pair solutions and verify solutions by substituting the coordinates into both equations. One activity includes tables of values for both equations alongside a graph.
Lesson 6
Substitution and Elimination
Students rewrite equations in slope-intercept form and graph lines to estimate intersections (e.g., instructions to rewrite both equations in slope-intercept form and the Student Activity that has students graph 3x−2y=7 and x+y=4). Students isolate a variable and substitute expressions (examples show solving y = x+1 and 2x+y=7 by substituting x+1 for y), so they practice writing one variable in terms of the other. The Desmos section and multiple activity pages have students enter equations like y=2x+3 and observe where two lines intersect, relating the graph to the algebraic equation.
Lesson 7
The Point of It All
Students find slopes from two given points and write equations in slope-intercept form (y = mx + b) in multiple activities (e.g., Sections asking for equations of Line A and Line B from two points). Students plot ordered pairs on coordinate grids, draw lines through those points, and estimate intersection points by reading coordinates from the graph. Students solve systems algebraically using substitution and elimination after expressing each line as an equation, and they check solutions by substituting values back into the equations. The activity set includes real-world word problems (delivery fee and babysitting scenarios) where students solve for an unknown quantity given a total.
Lesson 8
Linear Algebra In the Wild
Students repeatedly define variables for two quantities (e.g., Let x = price per pound, Let y = total cost; Let x = number of hours, Let y = total cost). Students write equations that express one quantity in terms of the other in function form (e.g., y = 20x + 50, y = 30x, y = 2x + 15) and solve systems to find values. The materials explicitly frame y as a dependent variable in terms of x (for break-even and cost comparisons) and present solutions as ordered pairs (e.g., (5, 150), (30, 35)).
Lesson 9
Unit 7 Test
Students set up and solve real-world linear equations such as Jamie earning $12/hour plus a $50 bonus (12h + 50 = 122) and gym/class cost problems, showing representation of two quantities in a context. Students represent two unknowns and form systems from ticket-price problems (two families' purchases lead to two equations) and solve those systems algebraically. Students graph linear equations given in y = mx + b form (e.g., y = 2x − 1) and plot/interprete intersections of lines to find solutions to systems.
Final Project
Getting Ready for College
Students are directed to let one variable represent the independent quantity and another represent total cost (e.g., housing: let n = months and C = total cost; transportation: let x = miles and C = total cost; entertainment: let h = hours and C = total cost; meal plans: let w = weeks and C = total cost). Students write explicit equations for each real-world option (e.g., C = 1200m and C = 1500 + 1050m; C = 225 + 0.60x and C = 1.25x; C = 20 and C = 5 + 1.5h; C = 80w and C = 100 + 50w; phone plan equations) and complete tables of values (phone plan table, housing cost table). Students graph the equations, mark intersections/break-even points, and interpret slope and intercept (identify cost per week, fixed startup costs, and break-even months/miles/hours) to relate the graphs and tables back to the equations.

Unit 8: Data
Lesson 2
Scatterplots
Students practice identifying independent and dependent variables and labeling axes on multiple activity pages (e.g., Hours Studied vs. Test Score, Time Spent Baking vs. Number of Recipes Mastered). Students analyze scatterplots by identifying positive/negative/no relationships, linear vs. nonlinear patterns, clusters and outliers, and draw or select best‑fit lines to describe trends. Students make numerical predictions from best‑fit lines and extend lines to estimate values beyond the data, and they compare variability to judge strength of relationships.
Lesson 3
Constructing a Scatter Plot
Students work with multiple real-world tables of paired data (hours studied vs. grade, height vs. arm span, temperature vs. ice cream sales, etc.) and plot those ordered pairs onto scatterplots. The activities explicitly ask students to label the x-axis as the independent variable and the y-axis as the dependent variable (Activity 2 Step 1). Students draw best-fit lines, analyze graphs for linear vs. nonlinear relationships, identify clusters and outliers, and make numerical predictions from the graphs and tables.
Lesson 4
Linear Models
Students identify independent and dependent variables and write equations in y = mx + b form in multiple activities (for example, the ice cream example labels x as degrees above 60 and y as cones sold and uses y = 2x + 50 to predict sales). Activity pages ask students to match scatterplots to equations, find slope and y-intercept from a best-fit line, and write the linear model (several student pages require writing the equation for graphs 5–8 and free-response problems). The Bird Migration activity has students record data in a table, plot ordered pairs on a scatterplot, draw a best-fit line, calculate the rate using two points, form the equation y = mx + b, and use it to make predictions.
Lesson 6
Unit 8 Test
Students label axes and identify independent and dependent variables in exercises such as Study Time vs. Test Scores (questions c and d) and multiple scatterplot tasks that ask for identification of variables. Several items ask students to write or select linear equations to match graphs (Questions 13 and 14, with answer keys like y = 4x + 2 and y = −8x + 40). Students are given tables of paired measurement data (e.g., Hours of Social Media vs. Number of Texts Sent, Missing Assignments vs. Test Score) and asked to plot ordered pairs on blank grids, make predictions from the graph, and match graphs to real-world scenarios.
Final Project
Collecting and Organizing Data
The lesson asks students to collect two quantitative variables (e.g., jumping jacks and heart rate), record paired data in a numerical table, and plot each pair on a scatterplot with labeled axes. Activities guide students to analyze scatterplots—identify positive/negative/no trend, draw an informal line of best fit, and describe patterns and outliers. The Parent Plan explicitly states students should "use the equation of a linear model to solve problems... interpreting the slope and intercept," and the poster/checklist asks for a neatly labeled scatterplot and numerical summary.

Unit 9: Semester Exams
Lesson 2
Proportions Review
Students are asked to write and match proportional equations such as y = 6x, y = 4x, and y = 10x (Activity 2 and Activity 3). Students graph given equations (e.g., graph y = 6x), label points, circle the origin, and interpret points like (0,0) and (1,6) in context (Activity 3). The Parent Plan and activities include real-world contexts (cost t = pn example, speed and recipe problems) and prompt students to create an equation, make a table, graph the relationship, and explain what the graph and points mean (Activity 1, Activity 3).
Lesson 3
Expressions Review
Students work with tables of paired quantities (e.g., Hours: 1,2,3 and Earnings: 14,28,42) and are asked to list and graph ordered pairs and write equations such as y = 14x and y = 75x. Students write equations from real-world contexts (e.g., delivery service y = 18x + 12, babysitting Job A: y = 18x, Job B: y = 12x + 20, phone plans y = 20x and y = 15x + 30) and graph those equations to compare rates. Students are prompted to interpret slope and intercept (e.g., "What does the slope represent?", "What does the y-intercept represent?", "What does (0,0) represent?").
Lesson 5
Semester Exam
Students write equations from real-world contexts (e.g., problem 33 asks for C = 11t + 4 for movie tickets and problem 34 asks for an equation and unit rate for a runner). Students analyze tables and proportional relationships (problem 17 gives a table and asks to determine proportionality and find the constant of proportionality). Students graph linear relationships and interpret slope and intercept (problem 20 asks to graph y = 4x and describe the relationship; problems 35 and 37 require plotting points, finding slopes, and writing equations).
Lesson 6
Functions Review
Students write equations from real-world situations (e.g., write y = 18h for a delivery driver earning $18 per hour; write y = 12x + 10 for a bike rental with a fixed fee and per-hour rate). Students construct functions from verbal descriptions, fill tables from a given rule (e.g., "Multiply by 2, then subtract 1" → y = 2x − 1), and graph equations such as y = 3x − 2 while identifying intercepts. Students compare a function given algebraically to one given as points (table of ordered pairs) to find and compare rates of change, and they interpret slope and intercepts in context.
Lesson 8
Linear Equations Review
Students define variables and write equations from real-world contexts in Activity 4 (e.g., m for months with 25 + 15m = 100, and 6 + 2m = 34 for taxi fare). Students practice graphing linear equations and computing slope in Activity 2 (e.g., graph y = x - 3 and y = -2x + 1, find slope from two points). Students solve for unknowns and interpret solutions in context for each word problem, showing work that links quantities algebraically.
Lesson 9
Data Review
Students analyze scatterplots and describe relationships between two variables in Activity 3, identifying positive/negative/no correlation and considering closeness of points to a line of best fit. The Parent Plan explicitly states students will "informally fit a straight line" and "use the equation of a linear model to solve problems... interpreting the slope and intercept." The lesson includes a web resource titled "Write an Equation for a Line of Best Fit," indicating an expectation to connect linear models with equations.
Lesson 10
Semester Exam
Students write functions from real-world descriptions (Problem 8: "You earn $10 per hour. Write a function that represents your total earnings." with answer y = 10x) and set up/solve real-world linear equations (Problem 35: tutor charges $18/hour plus $30 fee). Students graph equations (Problem 6: graph y = 2x - 4) and plot/use tables of ordered pairs to find intercepts (Problem 4 gives a table of x,y pairs to find the x-intercept). Students also analyze relationships from scatter plots (Problem 46 asks about correlation) and solve by graphing (Problem 32 finds the intersection (2,4)).