


Seventh Grade - MATH
5: Math
Unit 8: Statistics
Lesson 8
Making Inferences
Students are instructed to use random sampling (e.g., reach into a candy package and pull out 10 candies) and to record the frequency of each candy color, create a dot plot, and compute part-to-whole ratios and percentages for each color. The activity directs students to compare sample percentages with the whole-package frequencies by separating and counting all candies in the bag (Step Five) and includes an optional Step Six to compare sample and population percentages. Students also answer reflection questions about whether their sample represented the population and how to improve representativeness.
Lesson 9
Comparing Populations
Students use bar graphs and dot plots with counts to make inferences about populations (e.g., the height histograms for 10- and 11-year-olds and stacked dot plots for pumpkins and zucchinis). The activity asks students to estimate a fraction from observed frequencies directly — for example, "About what fraction of 11-year-olds are likely to be between 55 and 60 inches tall?" (answer: 1/2). Students are also asked to create stacked dot plots and to study overlap and shared data values, which requires reading and using observed frequencies.
Lesson 10
Unit 8 Test
Students work with frequency tables and counts (for example, the "Youth Ages at the Fishing Rodeo" table and the "Favorite Day to Visit the Movie Theater" table) and are asked to create dot plots and count how many responses each category received. Students answer questions that require comparing frequencies (for example, determining how many movie-goers provided data, how many more prefer Friday to Wednesday, and which day should be inferred as busiest). The unit also includes items about sampling variability and using data from random samples to draw inferences (listed in the skills section).
3: Math
Unit 4: Probability
Lesson 1
What Is Probability?
Students perform repeated coin-flip experiments (recording results for 5, 10, 50, 100 tosses), convert tallies to fractions/decimals/percentages, and answer questions comparing their experimental probabilities to the theoretical 1/2. The activity explicitly asks students whether their experimental probability matched the theoretical one and prompts reflection on what happens as the number of tosses increases. Students also calculate theoretical probabilities for a spinner with unequal sections (e.g., 6 orange, 2 green, 4 purple) and convert those probabilities into fraction/decimal/percent representations.
Lesson 2
Observing Probability
Students conduct chance experiments by spinning a three-color spinner with 12 sections (7 red, 3 blue, 2 yellow) for 10, 50, and 100 trials and record tallies and totals. Students calculate experimental probabilities from their recorded counts and express them as fractions, decimals, and percents, and then use those experimental probabilities to predict outcomes for 600 spins. The mixed review asks students to distinguish theoretical and experimental probability and to explain why results might change with more trials.
Lesson 3
Probability Models
Students spin a non-uniform spinner (7 red, 3 blue, 2 yellow), record 50 trial tallies, compute experimental probabilities (e.g., 29/50 = 0.58 for red) and compare those frequencies to the theoretical model (7/12, 3/12, 2/12). Students run dice-roll experiments (30, 60, 120 rolls), record counts, calculate relative frequencies, and compare those observed frequencies to the theoretical probability 1/6 while observing how results change with more trials. Students build probability models from real-world counts (e.g., 16 choir, 10 band, 8 orchestra), use the model to answer probability questions, and analyze discrepancies in Activity 4 by listing causes like bias, small sample size, or recording error.
Lesson 4
Compound Events
Students build probability models that are not uniform by listing repeated outcomes for non-equal chances (e.g., the pencil-box example with 3 red pens and 1 blue pen, the spinner with 2 red sections and 1 blue). Students compute probabilities from those models (counting favorable outcomes over total outcomes) and convert them to percents and expected counts when an experiment is repeated (e.g., predicting 20 occurrences out of 120). Students also use observed sample frequencies to make inferences about a larger population (the Timpony School District example: 14 of 60 -> estimate ~266 of 1,143).
Lesson 5
Simulations
Students run repeated trials and record frequencies in multiple activities (Blue Marble, Music Playlist, What Kind of Visitor?, The Library Hunt), counting rolls until a target outcome and calculating averages, fractions, and percents. In the Music Playlist activity students assign digits to genres using a non-uniform probability model (Pop 40%, Country 30%, Rap 20%, Instrumental 10%) and then simulate outcomes with random rolls. In The Library Hunt students use observed trial results to compute the experimental probability that it takes 4 or more picks and convert that fraction to a percent.
Lesson 6
Unit 4 Test
Students compute experimental probabilities from observed frequencies in multiple problems (e.g., rolling a die 60 times with fifteen 6s, coin tossed 10 times with 7 heads, rolling a die 100 times with twenty 3s). Students design and run simulations (e.g., estimate how many draws until a red marble when 30% or 40% of items meet a condition) and record trial results to estimate probabilities. Students create probability models from counts (e.g., marbles or spinner sections) and are asked to compare experimental and theoretical probabilities and explain differences (Question 6c and similar prompts). The Parent Plan explicitly states developing a (possibly non-uniform) model from observed frequencies and gives the spinning-penny example as a target skill.
Final Project
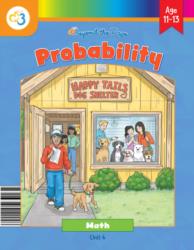
Happy Tails Dog Shelter
Students calculate a probability model by listing the 15 size+color outcomes and computing each probability as (count/60)×100 in Part 3. Students run a chance-process simulation in Part 4 using a 10-sided die to generate observed frequencies (rolls until a small black or large black dog appears) and record averages across trials. Students also place events on a probability line (including an equal-chance 0.5 event) and create sample spaces/tables/tree diagrams to enumerate all possible outcomes before building the model.
Unit 8: Data
Lesson 5
Categorical Data
Students compute relative frequencies and use them to compare groups (Things to Know; Activity 4 defines Relative Frequency = frequency/total and shows how to create a relative frequency table). In Activity 4 the text explicitly finds a probability from observed frequencies: "find the probability that a biker caught a cold: 18/90 = 0.20" and then compares 20% to 25% for drivers. Multiple activities and problems have students convert two‑way frequency tables to relative frequency tables and interpret proportions (Day 2–Day 3 activities and Problem sets).
Unit 9: Semester Exams
Lesson 4
Probability Review
Students compute experimental probabilities from observed trials (spinner spun 25 times with yellow landing 7 times, and they write 7/25 and 0.28). Students create probability models from observed frequency data (pets survey: Dogs 10, Cats 6, Hamsters 4 → probabilities 10/20, 6/20, 4/20). Students compare experimental and theoretical results and explain discrepancies (game with theoretical probability 1/4 asks whether exactly 5 wins in 20 trials is expected and asks how experimental probability approaches theoretical probability as trials increase).
Lesson 5
Semester Exam
Students compute an experimental probability when a spinner is spun 25 times and lands on yellow 7 times (Question 43a asks for experimental probability 7/25). Question 43b asks students to compare that experimental probability to the theoretical probability and explain how they might differ. Questions 44–45 ask students to create a probability model from counts (5 stars, 3 circles, 2 squares) and use it to find probabilities (e.g., not a circle), which has students form and apply a non-uniform model.
Lesson 9
Data Review
Students calculate and use relative frequencies in Activity 4, including filling a two-way relative frequency table (e.g., 12/30 = 0.40, 14/40 = 0.35, 12/50 = 0.24) and answering questions such as what percent of evening students prefer gaming and which activity is most popular in the morning. The parent-plan and activity descriptions explicitly ask students to classify categorical data and use relative frequencies to describe and compare groups. Several items require students to draw conclusions from observed frequencies (e.g., "Reading is most popular in the morning" based on the highest relative frequency).
Lesson 10
Semester Exam
Students calculate relative frequencies from a categorical frequency table in Problem 50 by using column totals and expressing answers as decimals. Unit 8 contains multiple data-analysis tasks (mean, median, MAD, IQR, box plot) that require students to work with observed data and summarize frequencies and spreads. The relative frequency table explicitly asks students to fill in probabilities-like decimals based on observed counts.