


Sixth Grade - MATH
5: Math
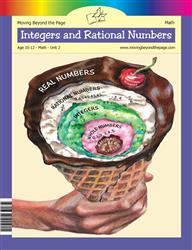
Unit 2: Integers and Rational Numbers
Lesson 4
Negative Numbers and Integers
The Parent Plan skills list explicitly names "Write, interpret, and explain statements of order for rational numbers in real-world contexts." Students represent real-world quantities with signed numbers in multiple contexts (temperatures, building floors, debt, game scores) and answer questions that ask them to compare and rank values (e.g., trivia scores, "Which player is in last place?", and "Which of them owed the bank more? Explain how you know."). Activities ask students to explain comparisons using the number line language (e.g., "farther to the left of zero") and to compute changes between negative and positive temperatures.
Lesson 5
Absolute Value and Inequalities
The Inequality Notation activity asks students to write inequalities in real-world contexts such as temperatures (Chillville, Fairbanks/Arctic), recipe measurements, and distances for a weather balloon and submersible. Several tasks require students to plot real-world values on number lines, compare them using > and <, and write reversible inequalities (e.g., (−)16 > (−<25 and |325| < |−1052|). The Practicing Absolute Value and Activity pages ask students to explain in words why a chosen temperature is colder than −12°F and to justify comparisons by referring to positions on a number line.
Lesson 7
Coordinate Problem Solving
Students plot and interpret positive and negative coordinates in multiple activities (e.g., plotting points in all four quadrants, naming plotted points on a lion drawing). Students calculate distances using absolute value ideas (questions asking distance from -3 to 5 and explanations that distances are always positive because they are absolute values). Students also practice numeric comparison with an explicit inequality problem (write which board is longer using an inequality: 4/5 < 8/9).
Lesson 8
Unit 2 Test
Students complete several comparison and ordering tasks with negative numbers (e.g., fill-in-the-blank items asking for >, <, or = with pairs such as -7 and -10, -6 and -2, and -3 and 3). Students interpret negative values in real-world contexts (identify -9 for the underground portion of a rod, represent Erica's money as 0, -2, and 3 when borrowing and repaying, and compare temperatures -11 and -2 to find the increase). Students plot integers on number lines and identify which value is closest to zero, and they work with absolute value comparisons (e.g., |4| = |−4|).
Unit 3: Ratios and Percentages
Lesson 3
Equivalent Ratios
Students complete a "Basic Skills Review #5" sheet that includes a problem asking them to compare numbers using the correct signs (> , < , =). The answer key shows specific comparisons with negative numbers and absolute value notation (for example, (<12;8) < 2; |(−<)| = |+3|; 4 < |(−9)|), so students practice ordering and working with absolute value expressions.
Lesson 5
Percentages
Students are asked to "Place the numbers in order from least to greatest: -4, |-9|, 2.5, 0, -1 1/2" on the Basic Skills Review page, requiring them to evaluate |-9| and compare negative and positive rational numbers. The answer key supplies the ordered list ((-)4, (-)1 1/2, 0, 2.5, |(-)9|), showing that students practice ordering negatives, fractions/decimals, zero, and an absolute value expression.
Final Project
What's the Best Buy?
Students set up and compute unit-price ratios by dividing price by quantity (Activity 3) and record those unit prices in data tables. Students compare the unit-price values for multiple product options and indicate the best buy with a star (Step Three / Activity 3). Students write explanations of which product they would choose and justify their choice using the numerical unit-price data (Step Four).
Unit 4: Algebraic Expressions
Lesson 4
Positive and Negative Numbers
Students learn and practice absolute value and opposites using number lines (multiple images and questions show |6| = 6 and that opposites are equal distance from zero). Students place and move between positive and negative numbers on number lines and solve real-world problems involving negatives (temperatures, elevations, debts) where they write expressions like 2 - 28 or -29 - (-16). The lesson also mentions using absolute value to determine which number is farther from zero and briefly references inequality language when comparing distances.
Lesson 5
Equivalent Expressions
Students practice comparing values using <, >, or = on the Basic Skills Review #8 (the answer key shows examples such as (-)9 < (-)3 and |(-)16| > (-)16). Students work with positive and negative numbers when simplifying expressions (instructions remind them to use rules for adding positive and negative numbers). Several activities require students to identify and compare numerical expressions (e.g., comparisons and order-of-operations problems).
Unit 5: Algebraic Equations
Lesson 5
Inequalities
Students write and interpret inequalities in real-world situations such as Casper's neighbor (n > 11), a roller coaster height requirement (n ≥ 3), José paying more than $5 (x > 5), and Violet owning more than 8 and less than 12 hats. Students translate number-line graphs to inequality statements and graph inequalities (open vs. closed dots, arrow direction) and complete practice items matching word statements to inequality symbols. Activities ask students to produce solution sets from contextual inequalities and to write inequalities that correspond to given number-line graphs.
Lesson 6
Solving Inequalities
Students write inequalities to represent real-world situations (e.g., n + 5 < 12 for shirts, 3n - 5 ≥ 22 for Farmer Joe) and complete activity pages that require writing an inequality from a word problem, solving it, and stating a reasonable solution set. The lesson provides a clue-words list mapping phrases ("less than," "at least," "no more than") to inequality symbols and has students graph and check solutions on number lines. Students also practice switching expressions and inequality directions and interpreting solution sets in context (choosing reasonable integer solutions).
Lesson 7
Independent and Dependent Variables
Students practice ordering integers in the Basic Skills Review item that asks them to put numbers (including negatives) in order from least to greatest. Students work with negative temperatures in the freezer word problem (y = x - 2) and compute and graph values that include negative numbers. Students solve and graph one-variable inequalities on number lines, which requires understanding the direction of inequality for positive and negative solutions.
Lesson 8
Unit 5 Test
Students write inequalities to represent real-world situations (e.g., Bryan: n - 3 < 6 leading to n < 9; Leah: n/4 ≥ 25 leading to n ≥ 100; Rich: n + 3 ≤ 12). Students solve inequalities that produce negative bounds and graph them on number lines (e.g., 4 < n + 6 → n > -2; n - 7 > -12 → n > -5, with open/closed dots and arrows). Students interpret solution sets in context and provide reasonable solution sets with explanations (e.g., Bryan's reasonable set {4,5,6,7,8} and justification why 0–3 are not reasonable).
Final Project
All About Me
Students are asked to write 4–6 inequalities that represent real-world facts about themselves (e.g., "I have fewer than 15 fish", "I earn more than $5 a week"). The project requires at least one inequality to be graphed on a number line and asks students to create an answer key and to interpret solutions in context. The Parent Plan and checklist explicitly list skills such as writing inequalities of the form x > < or x < c, graphing solution sets on number line diagrams, and interpreting the solution in the context of the problem.

Unit 8: Statistics
Lesson 3
Frequency Tables and Dot Plots
Students are asked to rearrange numerical data in order (e.g., dog heights are arranged from smallest to largest and Scenario 3 asks students to order the number of rides from highest to lowest). Students identify highest and lowest values in contexts (shortest/tallest dog, fastest time, most/least popular meal) and use number lines for dot plots labeled with numeric ranges. Activity questions repeatedly ask students to determine which responses have the greatest or least frequency, reinforcing comparisons of numeric values in real-world contexts.
Lesson 4
Stem-and-Leaf Plots
Students are asked to write data values in order from least to greatest and to construct and read stem-and-leaf plots (Activity 2). Questions ask students to identify the lowest and highest values and to count how many sessions have values "less than 60," "at least 65," and "at least 50 but less than 60" on real-world data (camp attendance and temperatures). The lesson also has students interpret which values are most common and where most values fall (e.g., "Most high temperatures were in the 80's").
Lesson 8
Making Inferences
Students write and solve an inequality in a real-world context in Basic Skills Review #16 (e.g., 4 + n ≤ 9 to represent Josie having no more than 9 fish). Students also work with coordinates that include negative values (points at (3, −2) and (−4, 2)) when finding horizontal and vertical distances.
Final Project
Statistical Study
Students are asked to organize numerical data as a "list of data values organized from smallest to largest" and to display data on number-line-based graphs such as dot plots and box plots. Students will label number-line axes for dot plots/histograms and place minimum, first quartile, median, third quartile, and maximum values on a box plot. The project prompts students to choose numerical attributes (e.g., temperature) and to record units of measure, which situates numbers in real-world contexts.
Unit 9: Skills Review
Lesson 1
Decimals, Factors, and Multiples
The Parent Plan lists "Understand ordering and absolute value of rational numbers" as a skill students will work on. The Wrapping Up section directs students to play a Balloon Pop Math game to practice ordering positive and negative numbers and to complete an online exercise titled "Ordering and Absolute Value." These items provide explicit student practice with ordering and absolute value of rational numbers.
Lesson 3
Expressions, Equations, and Percentages
The Skills list explicitly asks students to "Write an inequality of the form x > c or x < c to represent a constraint or condition in a real-world or mathematical problem" and to "represent solutions of such inequalities on number line diagrams." Activity 2 has students solve n + 2 > 5 and graph the solution on a number line, and write and solve the real-world inequality 4 + n ≤ 10 for Jayne's spending. The activity answer key shows students form, solve, and interpret inequalities in a real-world context (n ≤ 6) and identify reasonable solutions.
3: Math

Unit 1: Numbers
Lesson 5
Irrational Numbers
Students are asked to compare and order sets of numbers and to write answers in the form a < b < c (Activity 3 and related practice problems). Activities require students to square numbers to determine order when square roots are present and to place approximated square roots on a number line (Activities 3, 5, and 6). The review quiz includes a problem that asks students to compare and order √10, 3, and √12 and several tasks that involve working with negative and positive rational numbers (e.g., scuba diver depth, temperature change).
Lesson 6
Scientific Notation
Students are asked to compare pairs of numbers written in scientific notation using the symbols <, >, or = (Student Activity Page problems 7–13 and the example comparing 3.2 × 10^6 and 1.5 × 10^7). Several activity pages and answer keys show step-by-step comparisons by examining exponents and coefficients (e.g., comparing 2.4 × 10^6 > 3.6 × 10^5 and 5.1 × 10^-2 > 4.3 × 10^-3). The lesson embeds these comparison tasks in real-world-themed contexts (distances in space, virus sizes, populations) so students handle comparisons of quantities expressed in scientific notation.
Lesson 7
Arctic Marine Research
Students compare magnitudes in Phase 1 by determining which organism has larger cells (0.0000065 vs. 0.0000042) and by comparing cell counts given in scientific notation (1.2 × 10^8 vs. 9.5 × 10^7). In Phase 5 students work with contextual positive and negative temperatures (−15°C to 5°C) to find range and average and compute submarine depth changes using negative depths (from 0 to −450 m then rising 175 m). These tasks require students to order and compare rational numbers in real-world contexts such as organism measurements, population counts, temperatures, and depths.
Lesson 8
Unit 1 Test
Students are asked to "Compare and order the following numbers: √36, 5.5, and 6.1" and a similar item asking to order √49, 6.8, and 7, which requires writing numerical order with inequality symbols. The answer key shows ordered sta<ements using < (for<examp<e, 5.5 < √36 < 6.1), indicating students are expected to produce and interpret order statements for rational and irrational values. Students also solve real-world problems that produce negative and positive rational numbers (e.g., submarine/diver depths below sea level, company profit and loss), so they practice working with signed rational numbers in context.
Final Project
Mars Station Test Mission
Students work with a data table that lists temperatures including negative values (Average Temp: Arctic Tundra -10°C, Atacama Desert 6°C, Himalayan Mountains -4°C) and a column for Days Below -20°C. In Task 1 students calculate temperature differences (Answer Key shows differences of 30°C, 18°C, 24°C) and use those differences to compute heater energy per hour/day/year. In the final presentation students must compare numeric results (energy, production, costs, sunlight) across sites and defend a recommendation using at least three pieces of math-based evidence.
Unit 2: Proportions
Lesson 2
Unit Rates
Students compute unit rates as fractions and decimals (e.g., $9.60 ÷ 12 = $0.80; 300 ÷ 5 = 60 mph; 8 ÷ 20 = 0.4 laps/min). They compare those computed rates to decide which option is the better deal in many real-world contexts (e.g., sunscreen $0.71/oz vs $0.65/oz and Plan A $0.10/GB vs Plan B $0.094/GB). Directions explicitly tell students to "Find the unit rate for each option" and "Compare the unit rates," and answer keys list which option is cheaper or faster based on the numerical comparisons.
Final Project
Lemonade Stand
Students compute unit prices for lemons, sugar, and cups and record those values to decide which option is the best deal. They create tables and graph total cost versus number of lemons and answer questions about which line is steepest or flattest and which store offers better value. Students are asked to circle the best deal and explain their choice on activity pages, using unit rates and visual comparison of lines to justify decisions.

Unit 3: Expressions
Lesson 5
More Graphing Proportions
Students compute and compare unit rates that are negative in Activity 3 Part 3 (graph points (0,0),(1,-3),(2,-6),(3,-9) and equation y = -3x) and answer questions that ask them to identify the unit rate of the equation and the graphed line. The answer key explicitly compares negative slopes (e.g., unit rates -3 and -2) and states which relationship has the higher (less negative) or lower (more negative) unit rate. The lesson also asks students to explain what a negative unit rate indicates about the direction of the relationship (line goes downward left to right).
Final Project
Planes, Trains, and Automobiles
Students compute and compare numeric measures (speeds: 60, 80, 400 mph; times for 500 miles: 8.33, 6.25, 1.25 hours) and fill tables that list these values. Students plot and read distance-vs-time graphs and answer which mode is fastest or slowest, justifying answers by comparing slopes and numerical times (e.g., plane is fastest because it has the steepest slope and smallest travel time). Students also calculate total times including delays (e.g., 8.96, 6.75, 4.75 hours) and explicitly state which option is fastest/slowest after delays.

Unit 4: Probability
Lesson 1
What Is Probability?
Students place real-world events on a Probability Line labeled 0, 0.5, and 1 and decide whether events are Impossible, Unlikely, Equal Chance, Likely, or Certain. In the coin and spinner activities, students compute probabilities as fractions, decimals, and percents (for example 6/10 → 0.6 → 60%) and compare those numerical values to determine which outcomes are more or less likely. Students also answer questions that ask them to compare experimental and theoretical probabilities and to decide whether one probability is closer to or greater than another.
Final Project
Happy Tails Dog Shelter
Students place events on a probability line labeled 0, 0.5, and 1 and justify placements as more or less likely using the shelter data. They calculate and compare probabilities as fractions and percentages (e.g., 9/60 = 15%, 3/60 = 5%) when building a probability model. The sample answers explicitly compare likelihoods (e.g., equal chance for male vs female, likely medium dogs vs unlikely small white dogs) and ask students to explain why they placed events where they did.

Unit 5: Functions
Lesson 8
Comparing Functions
Students compute and compare rates of change from graphs, tables, equations, and verbal descriptions (e.g., Alex .05 vs. Bella .067 and the explicit statement 0.067 > 0.05). Students compare starting values and order amounts in context (e.g., Jordan's y-intercept 100 vs. Taylor's 275 and determining who started ahead). Students compare negative rates in a real context (Jordan's slope −3 and Taylor's slope −3.5) to decide who is losing money faster.
Lesson 9
Unit 5 Test
Students compare quantities in real-world contexts such as identifying which streaming service has the highest starting fee, which service's cost increases fastest, and which service costs the most after 6 months. In the water-temperature activity, students identify which experiment started at the lowest temperature, determine who reached boiling the fastest, and state whose water was hottest after a given time. Several tasks ask students to choose the higher starting value between two functions and to determine which of multiple graphs matches a described distance-over-time story (comparing rates and flat segments).
Unit 7: Linear Equations
Lesson 8
Linear Algebra In the Wild
Students compare numerical options in real-world contexts and draw conclusions about which option is cheaper (for example, the Streaming Showdown concludes: "If you watch fewer than 5 movies, choose StreamMore; if you watch more than 5 movies, choose CinemaNow; if you watch exactly 5 movies, either option costs the same"). Break-even activities ask students to set two cost expressions equal and then interpret the result to decide which option is better for quantities less than or greater than the break-even value. Student activity pages and answer keys repeatedly use language like "less than 5," "more than 5," and "cheaper" to express ordering relationships between quantities and costs.
Final Project
Getting Ready for College
Students write and solve cost equations (e.g., C=1200m and C=1500+1050m), compute numerical totals, and complete tables that compare values (Dormitory vs Apartment costs for 9, 10, and 12 months). Students graph cost lines and identify the break-even point and then answer reflection questions that ask which option is cheaper for specific time periods and why. In multiple parts (transportation, streaming, meal plans, phone plans) students set expressions equal, solve for a variable, and interpret which numerical option is greater or lesser over given ranges.

Unit 8: Data
Lesson 1
Statistics Review
Students repeatedly sort data sets from smallest to largest and order values to find medians, quartiles, and five-number summaries (e.g., steps for median, IQR, box plot creation). Several activities require students to arrange numbers and compare minimums and maximums (e.g., ordering scores, commute times, push-up counts, and jump-rope results).

Unit 9: Semester Exams
Lesson 1
Numbers Review
Students solve real-world problems involving positive and negative rational numbers (e.g., a submarine: −12 + 7 = −5, with final position described as 5 meters below sea level). Students compute signed results in contextual problems (e.g., temperature drop −2.5 × 6 = −15 and explain that the temperature dropped 15° total) and explain why a product's sign makes sense (e.g., explain (−3)(−5) is positive). Students are also asked to create their own real-world problem using positive and negative rational numbers and to solve and explain the answer.
Lesson 4
Probability Review
Students label points 0, 0.25, and 1 on a probability line and name the type of probability, which requires placing those rational numbers in order on a number line. Students compare likelihoods (for example, deciding if rolling a number greater than 5 is more or less likely than rolling a 5, or whether drawing a consonant is more likely than a vowel), which has them compare rational probability values. Students convert probabilities between fractions and decimals (e.g., 7/25 = 0.28, 21/26) and use these values to justify which outcomes are more or less likely.
Lesson 5
Semester Exam
Students solve multiple problems involving negative numbers and rational values, such as computing sums and quotients with negatives (e.g., -18 + 27, -48 ÷ 6) and determining sign of products. Students apply negative numbers to a real-world context when finding a submarine's new position after rising 125 feet from 350 feet below sea level (answer: -225 feet). Students also plot and read coordinates on a coordinate grid with negative axes and label points on a probability line, showing exposure to ordering on number lines and negative/positive values.