Math Unit - Statistics (/Online)
This item provides online access to Math Unit - Statistics. The digital curriculum is identical to the hard copy curriculum.
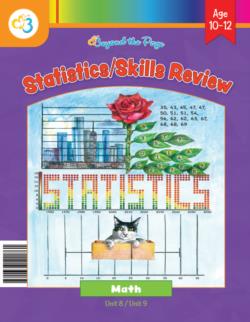
Math Unit – Statistics is a homeschool math curriculum for ages 10–12 that introduces students to collecting, organizing, analyzing, interpreting, and presenting data. Students begin by distinguishing statistical questions from non-statistical questions and examining numerical and categorical data, populations, samples, and bias. They then construct and compare frequency tables, dot plots, stem-and-leaf plots, histograms, and box plots while calculating measures of center and variability
At a Glance
Age Range: Ages 10–12 (usually 6th grade)
Estimated Time Commitment: 13 instructional lessons, approximately 45 minutes each
Prerequisites: Familiarity with basic numerical operations, averages and differences, basic graphs, and numerical data
Student Independence: Designed for students to work independently, with parent support as needed
Includes: Student-directed lessons, parent guidance, activity pages, answer keys, and instructional videos and web resources
Key Features
- Statistical Inquiry: In “Statistical Questions,” students distinguish statistical from non-statistical questions and write questions that anticipate variability in the answers. “Collecting Statistical Data” extends this work by asking students to identify attributes, populations, samples, appropriate collection methods, and possible sources of bias.
- Data Representation: Students organize information with frequency tables and construct several statistical displays. In “Representing Data,” they use the same State University class-size data to create a dot plot, stem-and-leaf plot, and histogram, allowing them to compare what each representation shows. They later construct box plots from five-number summaries.
- Quantitative Data Analysis: Students calculate mean, median, and mode from raw data and statistical displays, then examine range, interquartile range, and mean absolute deviation. Activities such as “Working with Measures of Variability” ask students to compare distributions and consider how spread and outliers affect a data set.
- Sampling and Inference: Students distinguish populations from samples and compare random and convenience sampling. In “Comparing Populations,” they examine distributions such as the heights of 10- and 11-year-olds and monthly cat and dog adoption data, using measures of center, variability, shape, and overlap to make evidence-based comparisons.
- Project-Based Application: In the “Statistical Study,” students develop a numerical statistical question, identify a population and collection method, gather data, choose an appropriate graph, and calculate measures of center and variability. They also construct a box plot, analyze their findings, and communicate the completed study through a poster or slideshow.
Learning Outcomes
By the end of this unit, students will be able to:
- Distinguish statistical questions from non-statistical questions.
- Classify data as numerical or categorical and identify methods of data collection.
- Distinguish populations from samples and recognize representative, random, biased, and convenience samples.
- Construct and interpret frequency tables, dot plots, stem-and-leaf plots, histograms, and box plots.
- Calculate and interpret mean, median, mode, range, interquartile range, and mean absolute deviation.
- Recognize symmetric, skewed, and random distribution patterns.
- Compare data distributions using measures of center, variability, shape, and overlap.
- Conduct and present a statistical study using collected numerical data.
Math Unit – Statistics develops statistics as a connected process rather than a collection of isolated calculations. Students move from asking statistical questions and evaluating samples to representing data, analyzing distributions, and drawing supported conclusions. The final statistical study brings these skills together in an original investigation based on data students collect and analyze themselves.
This item includes online access to Beyond the Page Online for 18 months. This includes Learning Gates, Portfolio and any curriculum or student activity pages that you have purchased.